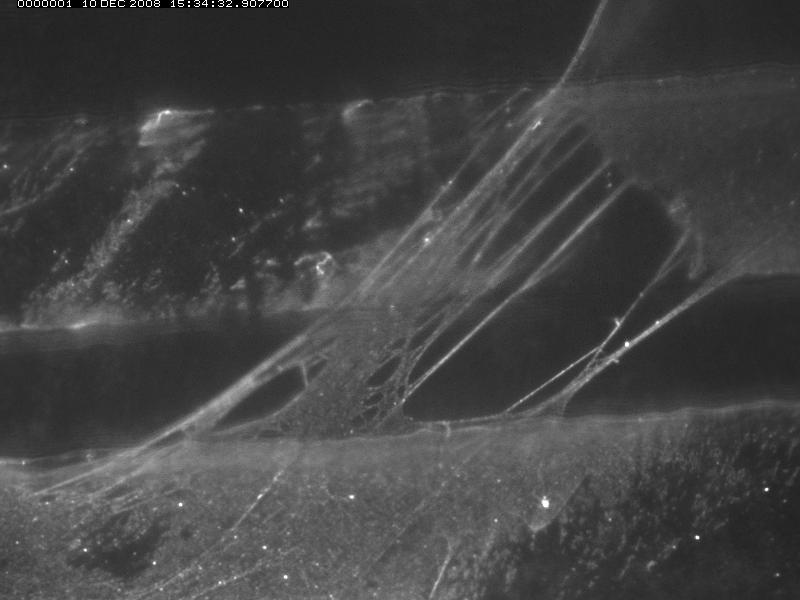
Fibrin Sheets

January 22, 2009
Molecularly thin fibrin sheets have been observed during experiments in our group.  There is some evidence that these sheets develop into fibrin networks.  Here is one image showing perhaps this exact phenomenon.  A sheet is laying across ridges made of hardened optical glue.  However the sheet appears to be separating into individual fibers.
Molecularly thin fibrin sheets have been observed during experiments in our group. There is some evidence that these sheets develop into fibrin networks. Here is one image showing perhaps this exact phenomenon. A sheet is laying across ridges made of hardened optical glue. However the sheet appears to be separating into individual fibers.

Fibrin Networks

January 22, 2009
Here is an example of a series of fibrin networks formed between ridges of optical glue.  Perhaps they formed from a sheet?
Here is an example of a series of fibrin networks formed between ridges of optical glue. Perhaps they formed from a sheet?

Mitotic Spindle

January 22, 2009
Model of the mitotic spindle and an isosurface from a 3D stack of fluorescence images of a real mitotic spindle. The model has been manually placed relative to the image data. A "make it better" button in the FluoroSim module of the CISMM Microscope Simulator will optimize the fit of the geometric model to the image information by forward simulation of the fluorescence microscope imaging process.
Model of the mitotic spindle and an isosurface from a 3D stack of fluorescence images of a real mitotic spindle. The model has been manually placed relative to the image data.

Multivariate Visualization

January 21, 2009
Three data sets are shown in this AFM image: topography is mapped directly to height, friction is mapped to color, and areas of high adhesion (normal to surface) are circled by contour lines.

Isosurface of Flourescence

January 21, 2009
This image shows a 3D isosurface of fluoresence in a fixed human ephethelial lung cell culture. The lower surface is of the cells and cilia; the upper is the mucus layer above.

A Tracked Strand of DNA

January 21, 2009
A strand of DNA tracked using cores. The red curve is the core. The blue curves are the DNA edges implied by the core location and radius.

TEM Simulator Movie

September 9, 2003

Movie

This is a movie of a TEM simulation of curved single wall nanotube being moved over an amorphous carbon background. It runs at 12 fps.

temsimulator2

This is a longer version of the same movie.  Both movies were made using a graphics-hardware-accelerated simulator produced by David Borland as part of our accelerated microscope simulation and analysis work.  The curved nanotube shown in the video is moved by hand using a 6-degree-of-freedom manipulation device while the background thickness is adjusted.  The combined background + tube simulation is run at 12 frames/second.

3DFM NanoRod Bead Vortex

July 25, 2003

Movie

This clip starts with a bead being positioned near a nanorod using a laser trap. Then, an orbit is applied to the rod using the magnets of the 3DFM and it starts to beat. A flow in the CCW direction is created, and the bead can be seen to flow around the rod. Then, the beat frequency is doubled, and the bead’s orbital radius increases.

NanoRod Stands on End in 3DFM

July 25, 2003

Movie

In this clip, we start with a NanoRod flat on the substrate, and are able to use the magnets to get the rod to stand up vertically on the coverslip. We then apply an orbitting voltage, and watch the rod’s tip move in a square-like orbit.