Microscope Simulator Tutorial: Simulating a Fluorescent Bead
This tutorial is for Microscope Simulator 1.3.1.
By the end of this tutorial, you will know how to add geometric models to the microscope simulator, change model parameters, set up the simulator to match the settings of your microscope, and generate simulated fluorescence images.
Launch the Microscope Simulator
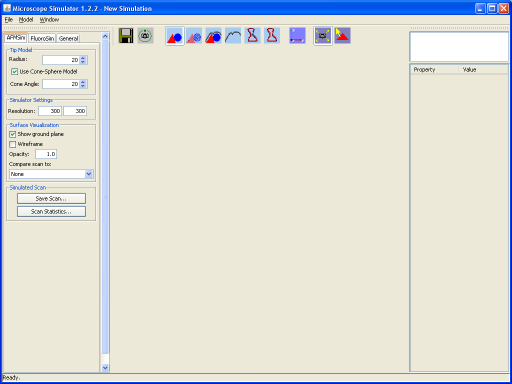
Click on the Start menu, go to All Programs->CISMM->Microscope Simulator 1.3.1->Microscope Simulator 1.3.1. This will start the program. A small orange dialog box will appear briefly followed by the main program window. After the program has loaded, the window will look like the image below.
Add a Geometric Model
Look at the menu bar and find the Model menu. This menu contains five geometric models built into the program (flexible tube, nanotube, plane, sphere, torus) that you can add to the scene. It also lets you import four geometry formats (OBJ, PLY, UNCA, VTK) and stacks of TIFFs. In this tutorial, we will stick to adding built-in geometries to our simulation.
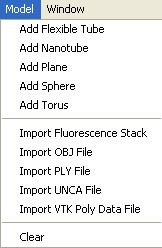
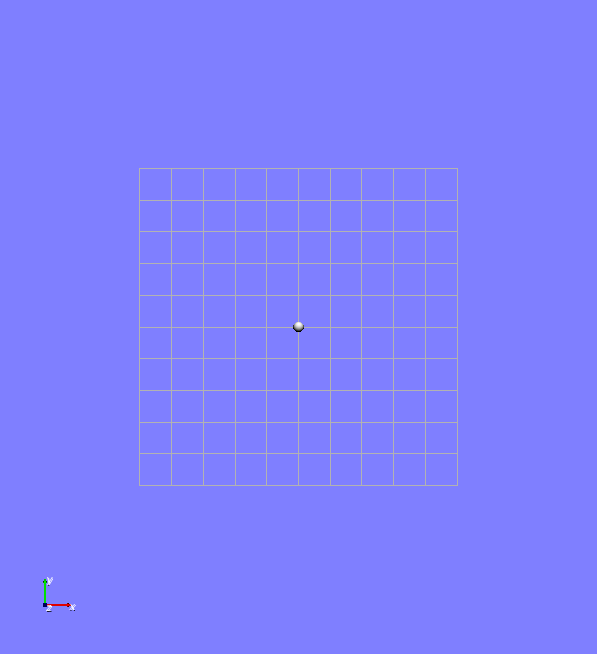
From the Model menu, select the Add Sphere option. You should now see a sphere in the middle of the window in a region with blue background. This region is called the Model Object Panel. Rotate the scene around by clicking and holding down the left mouse button in the Model Object Panel while dragging the mouse around. Notice the axes in the lower left of the Model Object Panel. These indicate the orientation of the world that you are rotating.
It’s easy to rotate the world into an orientation that isn’t very nice. To get back to the default orientation, click on the camera icon second from the left in the row of icons above the Model Object Panel.
With the default settings restored, the sphere looks very small. Zoom into the sphere by clicking and dragging in the Model Object Panel with the right mouse button. Notice that you can zoom in only so far. To zoom into the model even further, look for the list of model objects in the scene in the upper right corner of the program window. The list has only one item labeled “Sphere.” Right-click on the Sphere object and choose the first item in the menu that pops up, Focus on Object. Now the sphere will appear rather large. You will notice that the sphere looks bumpy. This is because geometric models in the Microscope Simulator are represented by a set of connected triangles. In other words, the sphere geometry is only approximately a sphere. Click on the button with the camera icon to reset the view again.

Change the Radius of the Sphere
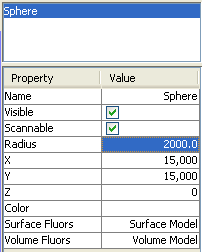
By default, the sphere has a radius of 500 nm. You can see this by looking at the table below the list of objects. This table has two columns, a Property column and Value column. The Property column gives the name of a model parameter and the Value column its value. Every geometric model has a list of parameters that you can adjust. Change the Radius parameter by clicking in the table entry in the Value column to the right of the Radius property. Change this value to 2000. You will see the sphere get larger relative to the background grid. Other properties of the sphere can be changed by clicking in their respective table entries in the Value column.
Change Settings to Match Your Microscope
Before we generate simulated fluorescence images, we need to change the fluorescence microscope simulator settings to those of your microscope. Let’s assume your microscope produces images that have 512 pixels in x and 512 pixels in y. Let’s also assume that the width of pixels represents 120nm in object space.
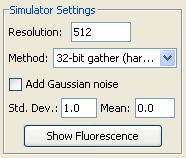
First, we’ll tell the FluoroSim module of the Microscope Simulator to generate 512×512 images. Look for the three tabs in the upper left corner of the program window. Click on the FluoroSim tab. Controls for generating simulated fluorescence images appear. Under the Simulator Settings panel, change the Resolution setting to 512. FluoroSim generates square images, so this value represents both the width and height of the image to be generated.
Next, we’ll change the physical size of what we call the simulation Region of Interest. Click on the General tab. By default, the Region of Interest spans 30,000nm in x and 30,000nm in y. Click on the Configure Region button. We need to define the region so that pixels in the generate images represent 120nm in object space. To figure out the size of the Region of Interest, we use the simple formula
ImageDimensions × PixelSize = X End = Y End
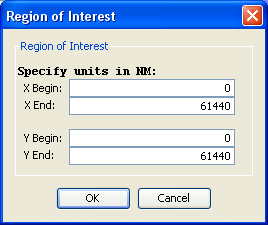
With our assumed microscope settings, the formula evaluates to 512 × 120 = 61,440. Change the entries for X End and Y End to 61,440 and click the OK button.
Notice how the sphere now appears smaller and in the bottom left quadrant of the background grid in the Model Object Panel? This is because the center and size of the sphere haven’t changed, but the size of the Region of Interest has. It got larger so the sphere appears smaller. Also, the sphere used to be centered in the Region of Interest, but it no longer is because the Region of Interest grew while the sphere remained in place.
You can change the position of the sphere one of two ways. The first way is to use the mouse and move the sphere by hand. To do this, click on the icon all the way on the right side of the row of icons above the Model Object Panel. This changes the mouse interaction mode so that you can now move objects by clicking on them in the Model Object Panel and dragging them with the mouse. Click on the sphere with the middle mouse button and drag it toward the center of the grid. You won’t be able to get the sphere perfectly centered in the new region of interest this way.
Using the second way to move model objects, you can center the sphere perfectly. To do this, change the X property of the sphere to 30,720. Do the same for the Y property. Now the sphere is centered perfectly in the region of interest. This method of moving objects is tedious, but it allows precise positioning of the model object.
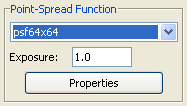
Finally, we’ll choose a point-spread function (PSF) that represents our microscope. We have included several example PSFs with the program that we will use for the purposes of this tutorial. Click on the FluoroSim tab again. You’ll see a pop-up menu under the Point Spread Function section that lists the set of PSFs currently available in the program. Scroll all the way down and select “psf64x64”. Nothing happens on the screen, but the PSF will be loaded into the program. We are now ready to generate simulated fluorescence images.
Generate Simulated Fluorescence Images
Now that we have added a model, changed settings to match our microscope, and chosen a point-spread function, we are ready to generate simulated fluorescence images. To do this, go to the Simulator Settings section under the FluoroSim tab and click on the Show Fluorescence button. A Fluorescence Image Window appears and shows the generated fluorescence image.
It may take a while to generate the image depending on the graphics acceleration hardware you have installed. You can speed up rendering by changing the Resolution parameter under the Simulator Settings section to a smaller number while you set up your simulation, then switch back to the full size image when you are ready to save your results.
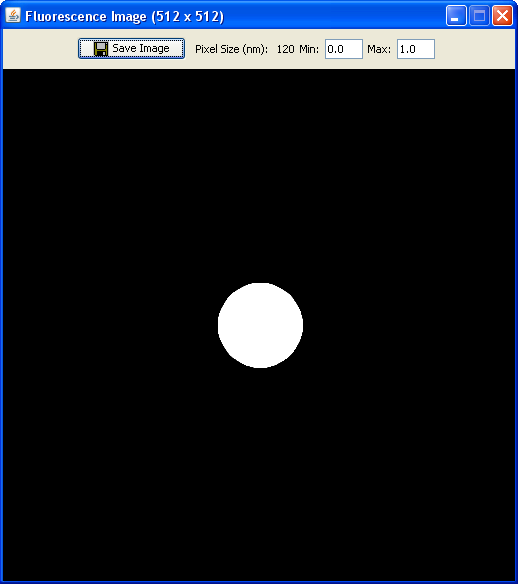
This image is not a very realistic image initially. We can adjust some parameters to make it appear more reasonable. In the Fluorescence Image Window, there are two settings at the top, Min and Max. The parameters control which values in the image show up as black and which show up as white, respectively. Values at or less than the Min setting will be black while values at or great than the Max setting will be white. Values in between are depicted by varying shades of gray. Basically, these parameters control the brightness and contrast of the image. Change the Max setting to 60,000. You’ll notice that the image of the sphere now has softer edges, but still appears as a bright white circle.
The next thing we can adjust is the Exposure setting under the FluoroSim tab. This setting currently has no physical meaning but is akin to the integration time of the microscope. Currently, it serves as a scaling factor on the PSF which in turn makes the generated image lighter or darker. Change this value to 0.001and press the return key. The generated image now appears more realistic, with a bright border caused by virtual surface labeling of the sphere, and a lighter interior caused by virtual volume labeling at a lower density.

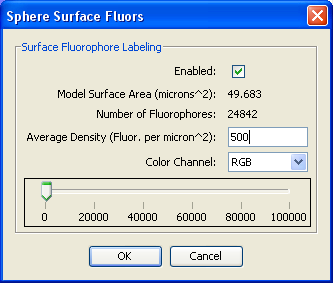
The last thing we can adjust is the density of the virtual fluorophores in surface and volume labeling of the sphere model. Click on the Surface Fluors property value. A window with controls for the surface fluorophore model appears. You can change the density of the surface fluorophores by entering a number in the Average Density field or by adjusting the slider bar at the bottom. Change the density to 500 and click OK. Notice how the bright border of the sphere in the simulated fluorescence image disappears. Next, we’ll disable volume labeling. Click on the Volume Fluors property. A similar dialog box will appear. The checkbox next to the Enable option indicates whether volume labeling for this object is enabled. Uncheck this box and click OK. Notice how the simulated fluorescence image has a brighter border again relative to the interior of the circle? The image has become fainter, so change the Max setting to 10,000 and press the return key.

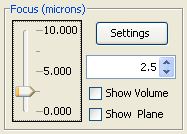
Finally, we’ll change the focal plane of the microscope. So far, the focal plane has been centered at the origin of the sphere. We’ll move the focal plane up and watch how the fluorescence image changes. The first section under the FluoroSim tab contains a Focus slider bar that, when moved, changes the focal plane of the microscope. Move the slider bar up to hatch mark midway between 0.000 and 5.000. The focal plane is now 2.5 microns above the origin of the sphere. Notice how much blurrier the fluorescence image is now that the sphere is out of focus.
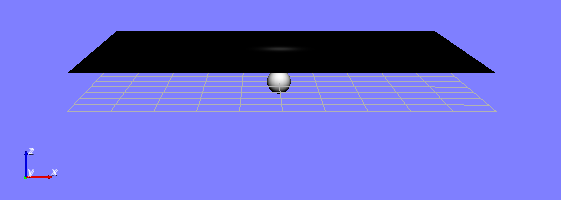
To see the focal plane relative to the sphere in the Model Object Panel, click on the Show Plane checkbox to the right of the Focus slider bar. In the default view, a plane with the generated fluorescence image appears in the Model Object Panel. This plane occludes the sphere, so we’ll need to adjust the viewing angle by left-clicking and dragging while moving the mouse straight up. If you rotate the scene far enough, you will be able to see the sphere under the focal plane. Now try moving the Focus slider once again. You will see the focal plane move up and down in relation to the sphere.
Congratulations! You have reached the end of the tutorial.