External Links
CISMM is one of several groups providing visualization and analysis tools freely usable by the biomedical microscopy community. There are a number of freely-available tools from other National Research Resources and elsewhere. We list some of them here for easy reference, along with brief descriptions.
Visualization Software
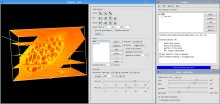
FluoRender
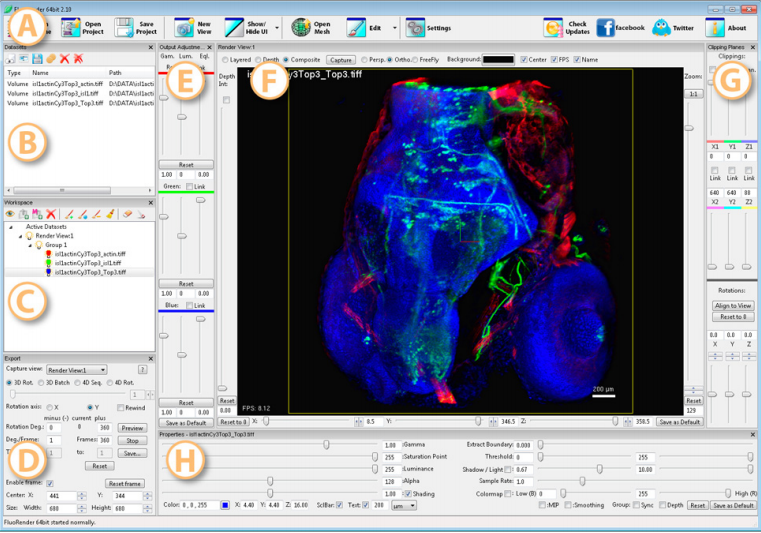
FluoRender is an interactive rendering tool for confocal microscopy data visualization. It combines the renderings ofmulti-channel volume data and polygon mesh data, where the properties of each dataset can be adjusted independently and quickly. The tool is designed especially for neurobiologists, and it helps them better visualize the fluorescent-stained confocal samples.
OsiriX
OsiriX is an image processing software dedicated to DICOM images (“.dcm” / “.DCM”extension) produced by imaging equipment (MRI, CT, PET, PET-CT, SPECT-CT, Ultrasounds, …). It is fully compliant with the DICOM standard for image comunication and image file formats. OsiriX is able to receive images transferred by DICOM communication protocol from any PACS or imaging modality (C-STORE SCP/SCU, and Query/Retrieve : C-MOVE SCU/SCP, C-FIND SCU/SCP, C-GET SCU/SCP, WADO).
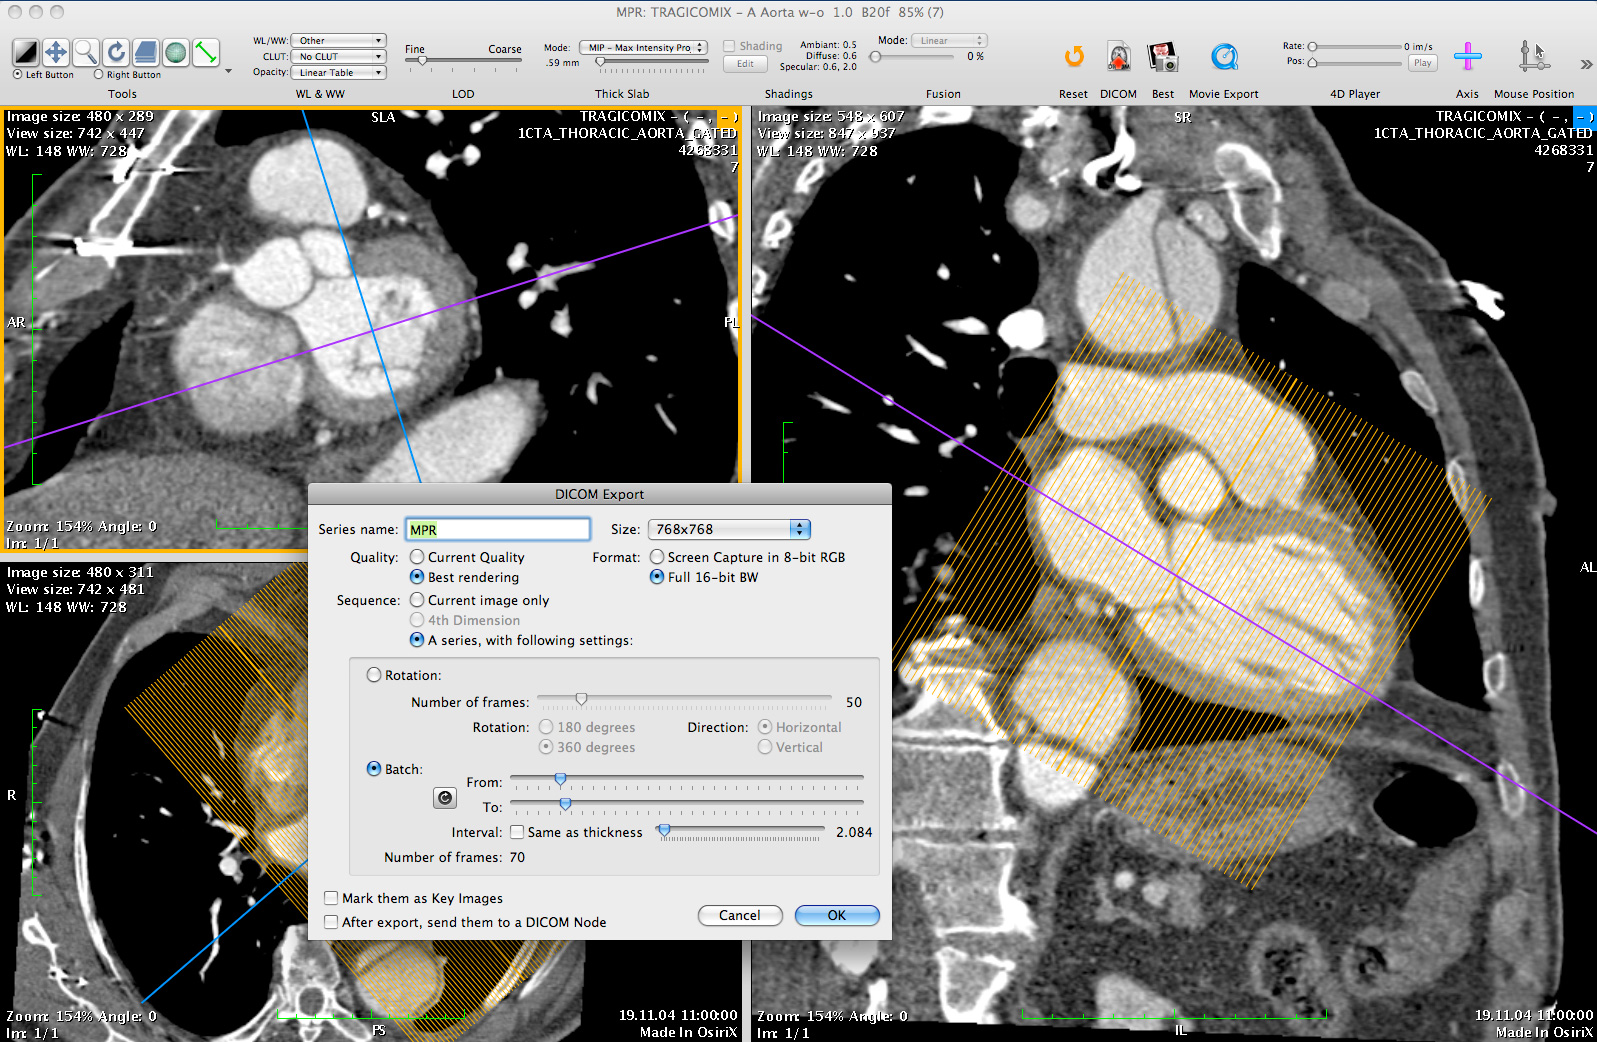 OsiriX has been specifically designed for navigation and visualization of multimodality and multidimensional images: 2D Viewer, 3D Viewer, 4D Viewer (3D series with temporal dimension, for example: Cardiac-CT) and 5D Viewer (3D series with temporal and functional dimensions, for example: Cardiac-PET-CT). The 3D Viewer offers all modern rendering modes: Multiplanar reconstruction (MPR), Surface Rendering, Volume Rendering and Maximum Intensity Projection (MIP). All these modes support 4D data and are able to produce image fusion between two different series (PET-CT and SPECT-CT display support).
VisIt
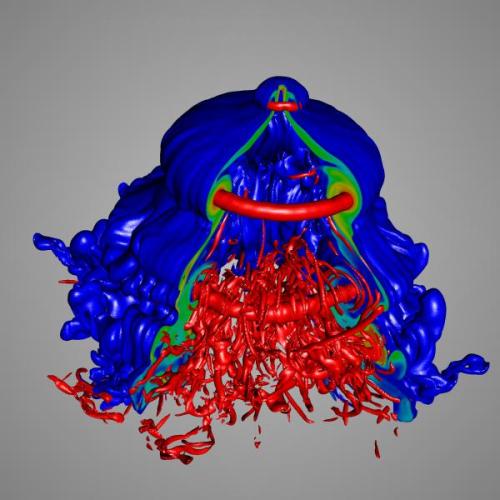 VisIt is a free interactive parallel visualization and graphical analysis tool for viewing scientific data on Unix and PC platforms. Users can quickly generate visualizations from their data, animate them through time, manipulate them, and save the resulting images for presentations. VisIt contains a rich set of visualization features so that you can view your data in a variety of ways. It can be used to visualize scalar and vector fields defined on two- and three-dimensional (2D and 3D) structured and unstructured meshes. VisIt was designed to handle very large data set sizes in the terascale range and yet can also handle small data sets in the kilobyte range.
Chimera

UCSF Chimera is a highly extensible program for interactive visualization and analysis of molecular structures and related data, including density maps, supramolecular assemblies, sequence alignments, docking results, trajectories, and conformational ensembles. High-quality images and animations can be generated. Chimera includes complete documentation and several tutorials, and can be downloaded free of charge for academic, government, non-profit, and personal use. Chimera is developed by the Resource for Biocomputing, Visualization, and Informatics and funded by the NIH National Center for Research Resources (grant P41-RR001081).
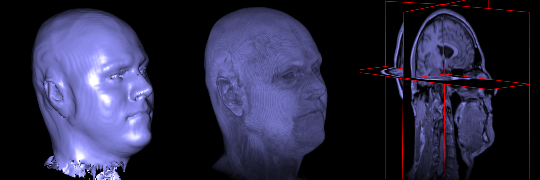
3DSlicer
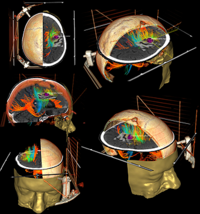 3DSlicer is a multi-platform, free and open source software package for visualization and medical image computing. It was originally designed for the display of human-scale 3D data sets from CT and MRI, but has also been extended to work with microscopy data sets.
VisBio
This program is available at http://www.openmicroscopy.org/site/support/visbio.
VisBio is an open-source biological visualization tool for multi-dimensional data developed by Curtis Rueden and Kevin Eliceiri at the Laboratory of Optical and Computational Instrumentation. VisBio provides 3D rendered views of multi-dimensional images that can be manipulated in 3D in real-time.
VisBio, using the remote OME Java API, can interact with OME directly for both reading and writing of image data.
Molecular Biology Toolkit
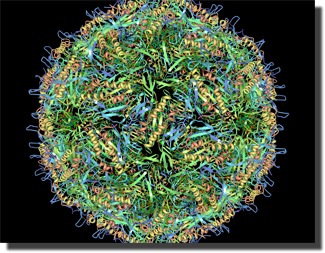
This toolkit, available at http://mbt.sdsc.edu, is a Java-based protein visualization and analysis toolkit including 2D and and 3D visualization components.
MIATool
The Microscopy Image Analysis Tool, available at http://www4.utsouthwestern.edu/wardlab/miatool.asp, is a software application designed for the viewing and processing of large sets of image data. It makes efficient use of memory by working with pointers to images rather than the images themselves, and it saves disk space by storing reusable processing parameters in lieu of actual processed images on the hard drive. In addition, MIATool allows for multiple interpretations of a given image data set, realized by different, in general N-dimensional, arrangements of pointers to the images. A physical image data set can therefore be represented, viewed, and processed independently in different ways.
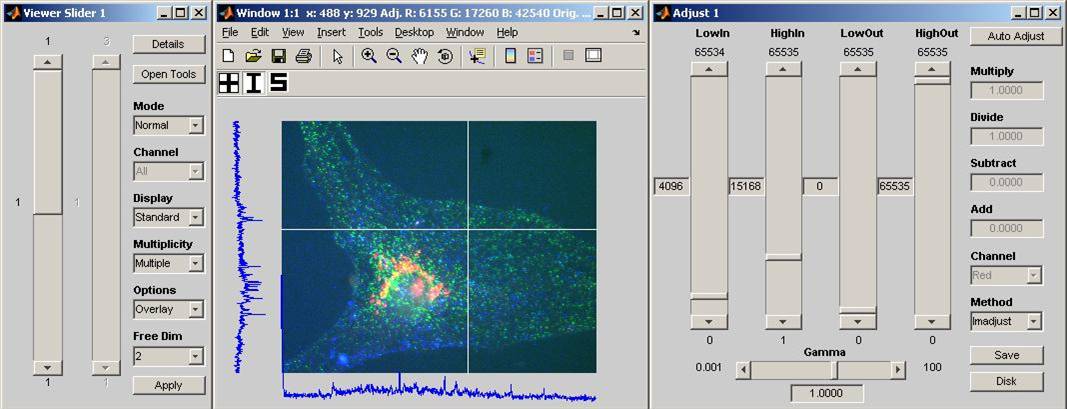
MIATool supports the viewing and processing of an N-dimensional array of images. At its core is an image viewer which allows the traversal of an N-dimensional array of images. Besides the standard display as pixels of varying intensity values, options are available to view the images as mesh or contour plots. In addition, options exist that allow the concurrent viewing of multiple images, either in parallel in separate windows, or as an RGB overlay. Useful features such as the reporting of pixel intensity values, the optional display of a crosshair, and the display of pixel intensity profiles along the row and column of the crosshair, are also supported.
VolRover
VolRover is an open-source volumetric visualization and segmentation toolkit. It specializes in viewing large volume datasets — data files are pre-processed on load for cached multi-resolution viewing. VolRover loads RawIV, RawV, Raw Geometry and MRC data formats, and installers are available for Windows, Linux and Mac OS X at http://cvcweb.ices.utexas.edu/ccv/projects/project.php?proID=9
V3D
V3D is an open-source system for the display and analysis of multivariate 3D time-series data. It runs on Mac, Linux, and Windows. It includes tools for cell segmentation, neuron tracing, brain registration, annotation, quantitative measurement and statistics. The most recent version includes a Matlab file I/O toolbox and a plugin architecture to enable expansion. The current version reads in a variety of 8-bit image files.
VolumeShop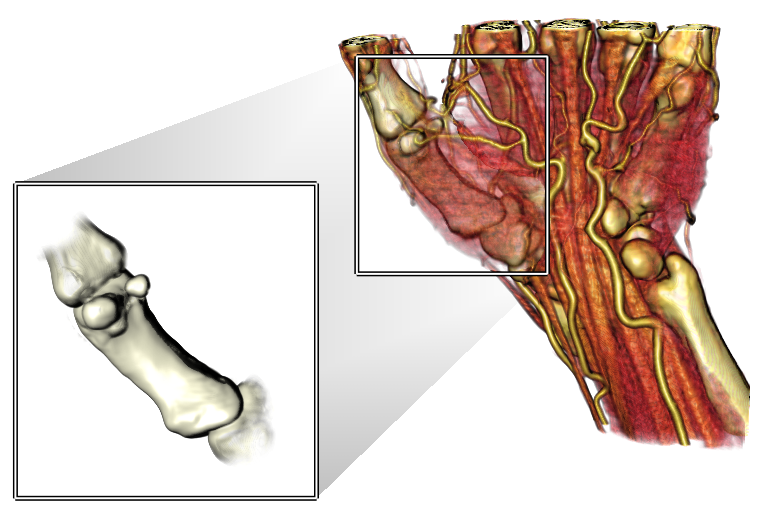
VolumeShop is an interactive hardware-accelerated application for direct volume illustration. It is free for non-commercial use. It was developed at the Technische Universitat Wien by Stefan Bruckner’s group.
BioBlender
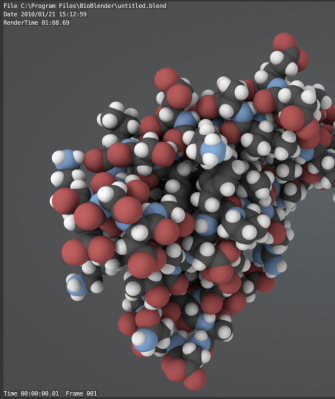
BioBlender is a software package built on the open-source 3D modeling software Blender.
With BioBlender users can handle proteins in the 3D space, displaying their surface in a photorealistic way, and elaborate protein movements on the basis of known conformations.
PDB files can be loaded from a user-defined directory or downloaded directly from the PDB site (by inserting the PDB code). The protein is displayed in 3D (as atoms or molecular surface) and the user can calculate and visualize its surface properties, Molecular Lipophilic Potential and Electrostatic Potential. For protein motion, BioBlender calculates intermediates between two conformations using Blender Game Engine. The program gives as output both the intermediate PDB files and the rendered images as a movie.
Slidebook
SlideBook software carries biomedical imaging through the entire experimental process. By addressing everything from device control to image processing to automated data analysis. It includes the following capabilities: Control, Acquire, Process, View, Identify, Track, Quantify, and Communicate. There are modules for 3D Deconvolution, Cellnet, FRET, Superresolution, Ratio, Photomanipulation, and Synchronization.
MSV project
The Multiscale Spatiotemporal Visualisation project is an international cooperation between the European @neurIST and VPHOP integrated projects, the US National Alliance for Medical Imaging Computing (NA-MIC), and the New Zealand-based IUPS Physiome initiative:
- to define an interactive visualisation paradigm for biomedical multiscale data,
- to validate it on the large collections produced by the VPH projects, and
- to develop a concrete implementation as an open-source extension to the Visualization Tool Kit (VTK), ready to be incorporated by virtually any biomedical modelling software project.
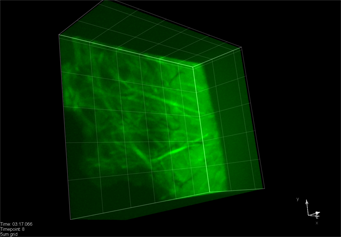
ZEN LE 2009
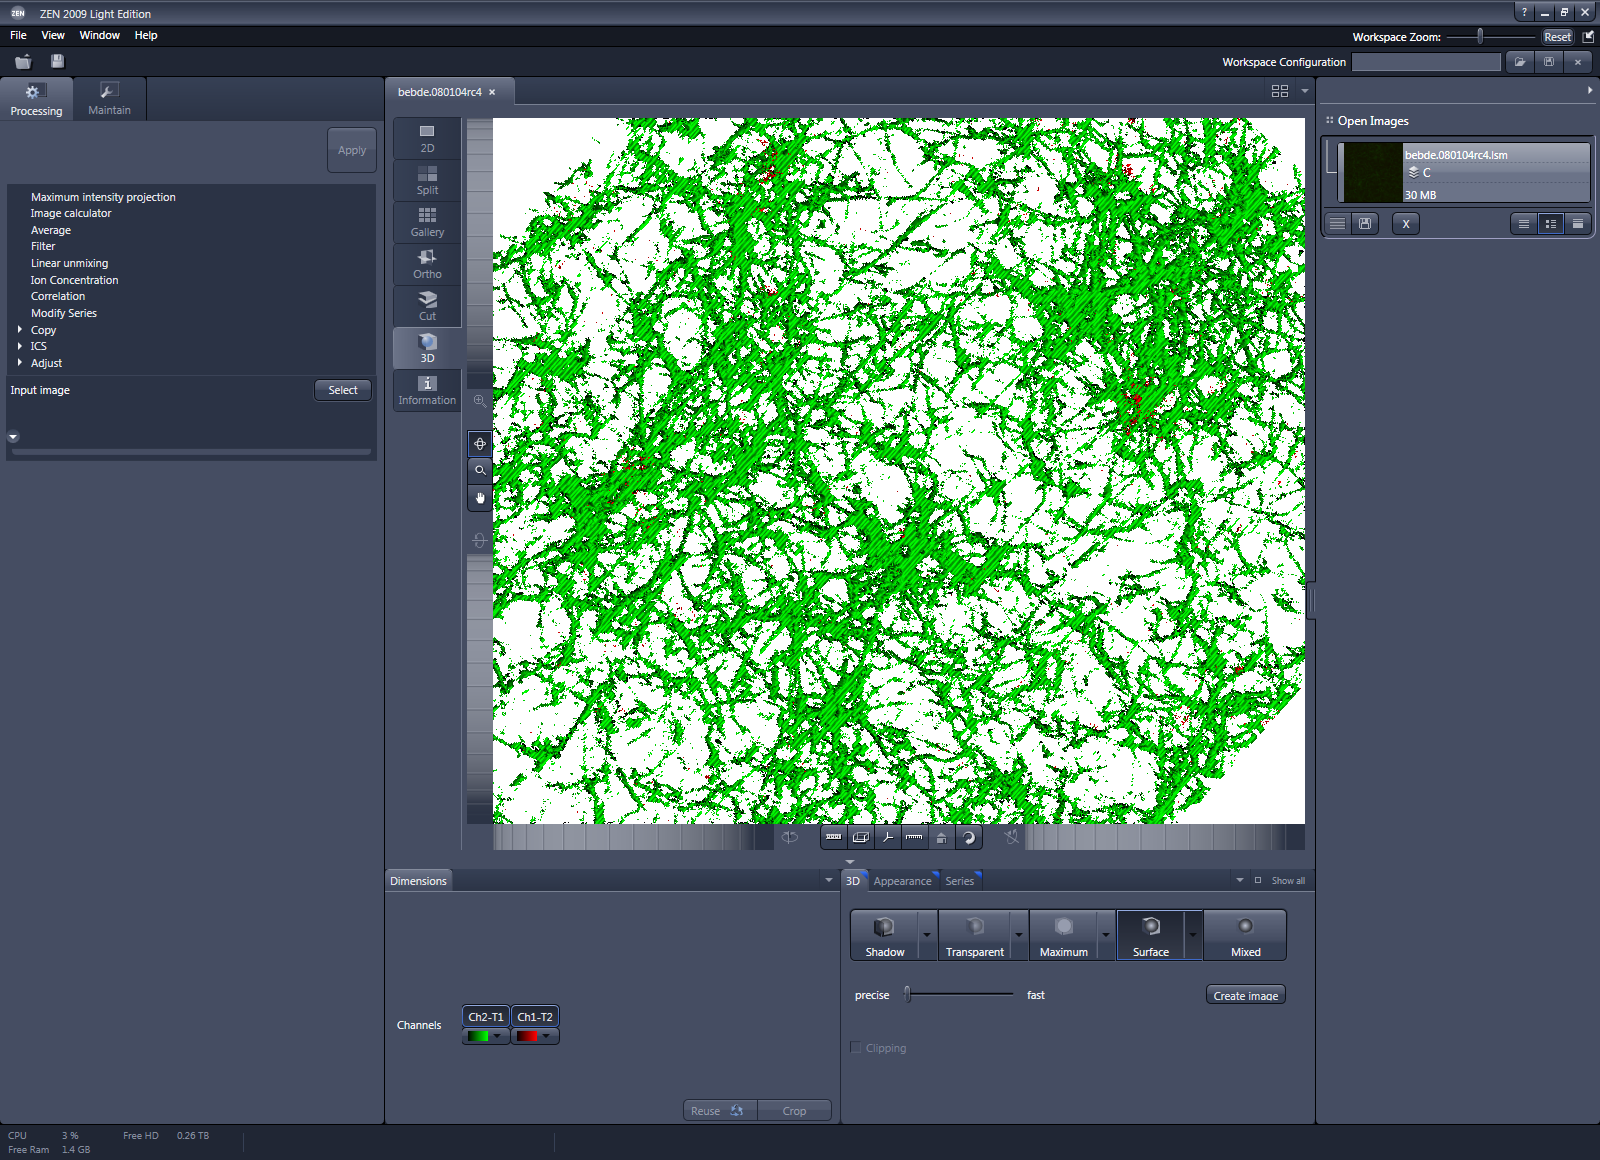
The ZEN LE 2009, that was offered as a free software package specific to LSM systems (.lsm files) by Zeiss, supports 3D basic rendering.You can download ZEN LE 2009 for 3D rendering from the Zeiss FTP site at ftp://lsm.zeiss.com with the following log-in info
- UserID: lsmusa
- Password: tfc
The file is at \\LSM\User_Area\Software\ZEN\ZEN_2009_LE\ZEN_2009_Light_Edition.zip
Slice:Drop
Slice:Drop is a web site you can visit that lets you instantly view your 3D medical image files on your browser without uploading your files or downloading or installing software. It is put out by Boston Children’s Hospital.
Fiji
Fiji is an open-source, Java-based set of extensions to ImageJ that include, among other things, a plug-in that has the ability to do 3D rendering (isosurfaces, direct volume rendering, and slice planes).
Particle Tracking
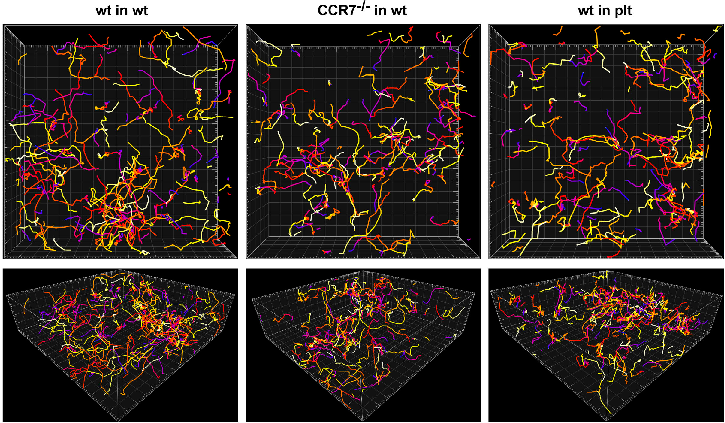
DIATRACK
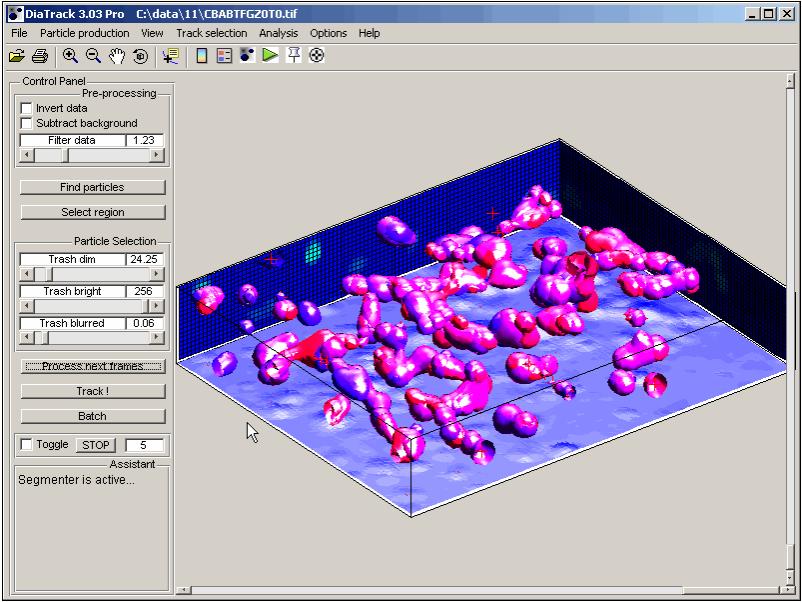
Benchmark object tracking software for 2D and 3D applications, such as biological imaging, rheology, or single molecule imaging. Reliably follow and characterize hundreds of objects simultaneously with a precision that reaches 0.01 pixels (depending on data). DiaTrack provides a compelling set of tools to extract quantitative information from image sequences.
MOSAIC Plugins for ImageJ
Several of the image-processing algorithms developed at the MOSAIC Group for fluorescence microscopy are available as plugins for the popular free image processing software ImageJ. The tool also supports 3D images (but still includes support also for 2D ones) and includes new and improved algorithms.
ImarisTrack
ImarisTrack is the most powerful commercially available live cell imaging, tracking & analysis software that rises to the challenge of monitoring temporal changes in biological systems (2D and 3D images over time). ImarisTrack is based on a choice of multiple sophisticated manual and automatic tracking algorithms and also includes an intuitive and interactive track editing tool if manual correction is necessary. Together this set of tools offers researchers the confidence and support necessary for analysing extremely large and complex data sets. ImarisTrack also provides translational and rotational drift correction which allows researchers to unravel key individual biological events which take place within a complex and dynamic environment (e.g. track a group of defined cells within a developing embryo).
DAOPHOT
DAOPHOT is a package for stellar photomoetry designed to deal with crowded fields. The package performs various tasks including finding objects, aperture photometry, obtaining the point spread function and profile fitting photometry. Profile fitting in crowded fields is performed iteratively which improves the accuracy of the photometry. It has also been used by groups studying single-molecule fluorescence.
Segmentation Tools
BioImage Suite
BioImage Suite is an integrated image analysis software suite developed at Yale University. BioImage Suite has extensive capabilities for both neuro/cardiac and abdominal image analysis and state of the art visualization. Many packages are available that are highly extensible, and provide functionality for image visualization and registration, surface editing, cardiac 4D multi-slice editing, diffusion tensor image processing, mouse segmentation and registration, and much more. It can be intergrated with other biomedical image processing software, such as FSL, AFNI, and SPM.
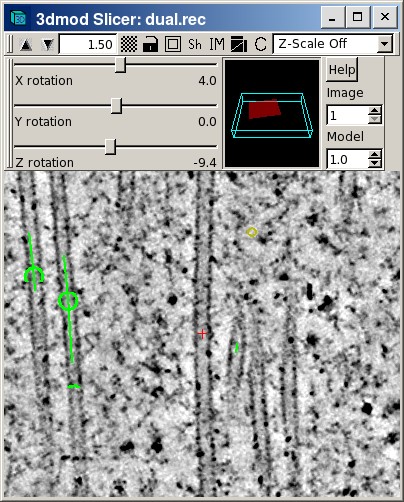
IMOD
This toolkit, available at http://bio3d.colorado.edu/imod/doc/3dmodguide.html, has support for the following:
- Hand-drawn points and lines and ways to convert lines through z into 3D contours
- Isosurfacing
- TimeSlices at arbitrary angles and positions (a la “Magic Cut Plane”) Open-source version is available
- Plug-ins
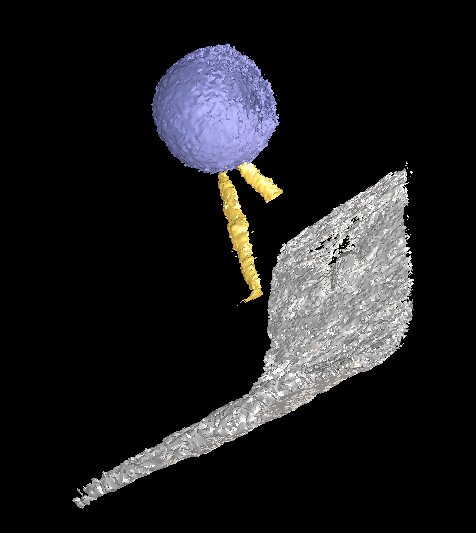
EM3D
This toolkit, available at http://em3d.stanford.edu/tutorials.html, has support for the following:
- Measurement tools
- Fiducial marker placement for aligning tilt series from EM
- Optimization of alignment from fiducial markers
- EM reconstruction
- Hand-drawn line-initiated segmentation that creates an isosurface at some calculated isovalue probably determined by maximal contrast near the hand-drawn lines
- Semi-automatic segmentation methods with user initialization and use a combination of contrast and isosurface smoothness for propagating the segmented surface
Seg3D
This toolkit, available at http://www.sci.utah.edu/cibc/software/42-seg3d.html, has support for the following:
- Fully 3D interface with multiple volumes managed as layers
- Automatic segmentation integrated with manual contouring
- Volume rendering with 2D transfer function manipulation in real-time
- Image processing and segmentation from the Insight Toolkit (ITK)
- Real time display of ITK filtering output allows for computational steering
- 64-bit enabled for handling large volumes on large memory machines
- Supports many common biomedical image formats
- Open source with BSD-style license
- Cross platform: Windows, OSX, and Linux
Farsight Toolkit
This toolkit, available at http://www.farsight-toolkit.org/wiki/FARSIGHT_Toolkit, provides Python wrappings for the Bio-Formats library, the Open Microscopy Environment, ITK, and a number of other modules (segmentation, registration, mosaicing, etc).
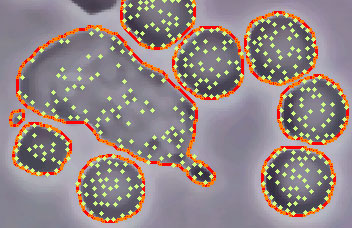
2D cell segmentation
There are several ImageJ plugins to handle cell segmentation tasks:
- Cell counter: http://rsbweb.nih.gov/ij/plugins/cell-counter.html
- Cell outliner: http://rsbweb.nih.gov/ij/plugins/cell-outliner.html
- Multi-cell outliner: http://rsbweb.nih.gov/ij/plugins/multi-cell-outliner.html
- Particle tracker: http://weeman.inf.ethz.ch/ParticleTracker/
- Cell tracker: http://www.imagescience.org/meijering/software/mtrackj/
The Database Research Group at OSU also has a cell-tracking software system at
CellProfiler is open-source software to enable biologists to quantitatively measure phenotypes from thousands of images automatically. They also make CellProfiler Analyst with machine-learning tools for identifying phenotypes. These are available at
sephaCe is an open-source tool for automatic segmentation of adherent biological cell boundaries from brightfield microscopy images. It is available from
- http://www.stanford.edu/~rsali/sephace
3D Cell Segmentation
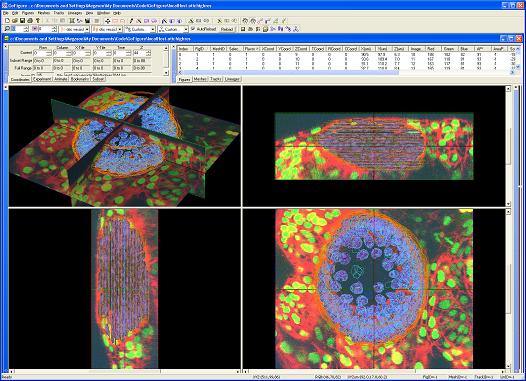
GoFigure is an image analysis software package specifically designed for visualizing, tracking, and analyzing cells in multidimensional confocal/two-photon image sets.
Neuron/linear object tracing
Simple Neurite Tracer is a free plugin for ImageJ that provides semi-automatic tracing of neurons or other tube-like structures through 3D image stacks.
NeuronJ is an ImageJ plugin (free for not-for-profit purposes) for neurite tracing and quantification.
TubeTK is an API and set of command-line tools (along with integration into Slicer3D) to track trees of tubes in 2D and 3D.
Neuromantic is a free application for the semi-manual or semi-automatic reconstruction of neurons for single images or image stacks.
Registration and Mosaicking
imago
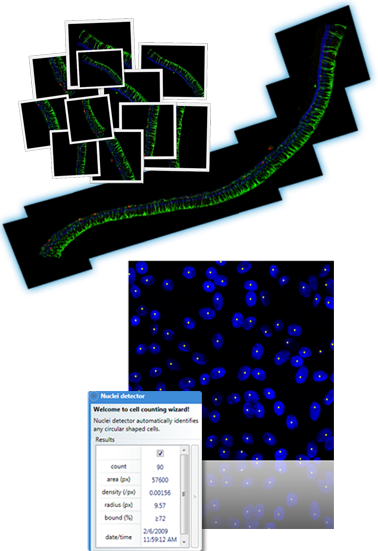
Imago provides a browsable interface for collections of microscopy images, similar to iPhoto or Picasa. It also can be used to annotate images, create image mosaics, and identify and count cells.
FAIR
FAIR stands for Flexible Algorithms for Image Registration and is a collection of MATLAB files in combination with an excellent documentation. FAIR is designed as an academic and teaching tool. It can be used to explore existing techniques or to invent new features (please let me know). Though the focus is on exploring methods, FAIR can also be used for established tasks.
Deconvolution
DeconvolutionLab
DeconvolutionLab is an ImageJ plug-in featuring several 3D deconvolution algorithms, including 1) Inverse filter, 2) Regularized inverse filter, 3) Landweber, 4) Threshold Landweber, 5) Tikhonov-Miller, 6) Richardson-Lucy, 7) Richardson-Lucy with TV Regularization. It also includes a convolution tool to generate simulated dataset with additive noise.
Image Stitching
Hugin
The Hugin panoramic photo-stitching program enables the assembly of mosaic images into panoramas and overlapping pictures.
Utilities
File Translation: Debabeler
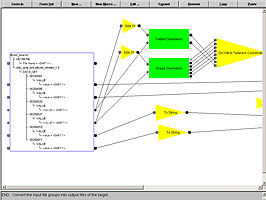
The LONI Debabeler is a an extensible tool used to create and customize translations between medical image file formats. Its visual programming environment provides an intuitive and easy way to modify a variety of existing translations to meet researchers’ needs.
Plot Digitizer
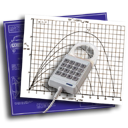 Plot Digitizer is a Java program used to digitize scanned plots of functional data. Often data is found presented in reports and references as functional X-Y type scatter or line plots. In order to use this data, it must somehow be digitized. This program will allow you to take a scanned image of a plot (in GIF, JPEG, or PNG format) and quickly digitize values off the plot just by clicking the mouse on each data point. The numbers can then be saved to a text file and used where ever you need them. Plot Digitizer works with both linear and logarithmic axis scales. Besides digitizing points off of data plots, this program can be used to digitize other types of scanned data (such as scaled drawings or orthographic photos).
Image Databases
Bisque
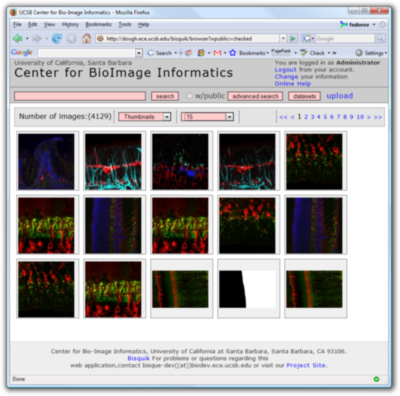
The Bio-Image Semantic Query User Environment (Bisque) from the Center for Bio-Image Informatics at UCSB was developed for the exchange and exploration of biological images. The Bisque system supports several areas useful for imaging researchers from image capture to image analysis and querying. Bisque is centered around a database of images and metadata. Search and comparison of datasets by image data and content is supported. Novel semantic analyses are integrated into the system to enable high-level semantic queries and comparison of image content.
(Semi) Automated Microscopy
The Micropilot software from EMBL is a computer program that can rapidly learn what a scientist is looking for in an experiment and then take over the laborious and time-consuming task, automatically performing complex microscopy experiments when it detects cells with interesting features.
It analyzes low-resolution images taken by a microscope and, once it has identified a cell or structure the scientists are interested in, it automatically instructs the microscope to start the experiment. This can be as simple as recording high-resolution time-lapse videos or as complex as using lasers to interfere with fluorescently tagged proteins and recording the results.
Other Image Analysis Software
DIPlib and DIPimage
DIPimage is a MATLAB toolbox for scientific image processing and analysis. DIPlib is a platform independent scientific image processing library written in C. Both were developed by members of the Quantitative Imaging Group at the Faculty of Applied Sciences, Delft University of Technology.
SPM analysis software
Gwyddion is a modular program for SPM (scanning probe microscopy) data visualization and analysis. Primarily it is intended for analysis of height fields obtained by scanning probe microscopy techniques (AFM, MFM, STM, SNOM/NSOM), however it can be generally used for any other height field and image analysis, for instance for analysis of profilometry data.
Data archives and formats
CIP Survey
The National Cancer Institute has a CIP Survey of Biomedical Imaging Archives. The goal of this project is to create a survey of Publicly Available InVivo Medical Imaging Archives and the underlying software capabilities. It includes a list of publicly accessible DICOM based biomedical image archives. Following the table is an analysis of what was found upon reviewing each archive between August and October of 2010.
biosharing.org
BioSharing works to register well-constituted efforts developing standards for describing and sharing biosciences experiments, ensuring these resources are informative and discoverable, monitoring their:
- development, evolution and integration;
- implementation and use in databases; and
- adoption by data policies by funders and journals.
MIAME
Mechanical Simulation
SOFA
The Simulation Open Framework Architecture (SOFA) is an Open Source framework primarily targeted at real-time simulation, with an emphasis on medical simulation. It is mostly intended for the research community to help develop newer algorithms, but can also be used as an efficient prototyping tool.
OpenSim
The OpenSim project from the National Center for Simulation in Rehabilitation Research is a powerful and freely available tool for modeling and simulation of movement. Musculoskeletal modeling and dynamic simulation have recently emerged as powerful tools to uncover the biomechanical causes of movement abnormalities and to design improved treatments. Starting in 2006, we developed powerful, freely available software for simulating human movement, OpenSim. Users of this technology address fundamental issues in movement science and focus on critical areas of rehabilitation medicine, including stroke, spinal cord injury, cerebral palsy, prosthetics, orthotics, and osteoarthritis.