TRD 4: Discovery Systems: Visualization, Modeling, and Workflow
Our collaborators’ scientific workflows involve data collection, geometry extraction, modeling, simulation, and comparison with various models to see which best match experiment. This often requires several different tools, sometimes CISMM-supplied and sometimes external. TRD 4 is working to pull all of these tools together and provide complete problem-solving environments.
These new tools and workflow systems are enabling our collaborators to better understand macromolecular structures and interactions (including clotting disorders, cell motility and mitosis), develop mechanical models of biological processes (including breathing, mitosis, and blood flow), plan surgical interventions, and meaningfully compare the results of large numbers of experiments and simulations. The needs of our collaborators continually drive us to produce novel solutions for visualization, computer simulation, and modeling.
Workflow Systems
SketchBio is a tool to enable scientists to construct, view, and animate collections of molecules to understand and  illustrate cellular processes. To avoid re-implementing existing techniques, this tool will be tied to existing advanced modeling (UCSF Chimera), rendering (Blender) and simulation tools to produce complete hypothesis-testing workflows.
The CellMech project will add thermal-motion simulation and force-based structure interactions to simulate mitosis.
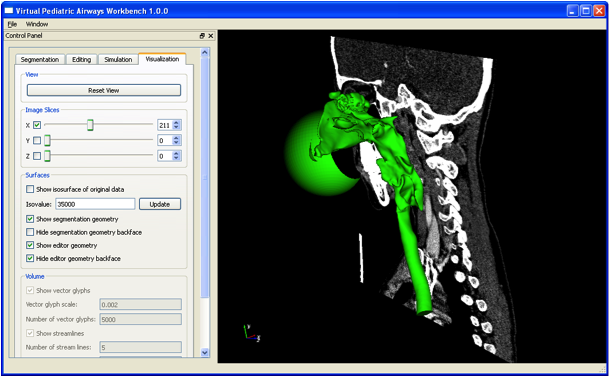
The Virtual Pediatric Airways Workbench (VPAW) provides computational fluid-dynamics simulations of modeled surgeries on infant airways. It includes the following capabilities:
- Load and segment data from CT scans of airways.
- Interactive 3D viewing of the data using 6-degree-of-freedom hand-held manipulator tools.
- Force-feedback editing of the geometry to produce potential surgery plans.
- Computational Fluid Dynamics simulation of flow through the multiple geometries throughout the breathing cycle.
- Display of multiple geometries and multiple airflows for direct visual comparison.
Ensemble Display Techniques
Many of the described workflows require comparisons. Comparison of model runs with different parameters or experimental data from different conditions requires effective summarization of multiple data sets. Because we don’t know ahead of time what relationships will emerge, visualization must augment statistical methods. For example, means and standard deviations do not capture all of the interesting flow behavior within a fibrin clot. We have three main goals, to display:
- Several Flows. Enable rapid location of regions with large flow magnitude or flow direction differences in sets of two or more fluid simulations.
- Several Surfaces. Enable rapid location of regions of difference among multiple surfaces from similar geometries (e.g. before and after surgery) and estimation of which surfaces differ and by how much.
- Large Ensembles. Enable effective reduction of large sample sets of images, geometries, and flows to a small set of exemplars that typify both the commonalities and the differences among the entire set so that the viewer can understand both the between-cluster and the within-cluster distribution of shape types.
Physically-Based Modeling
Our collaborators use microscopy and CT scans to produce 3D geometric models of structures. They then produce new models—detailed chromatin paths for the mitotic spindle, proposed surgeries for pediatric airways treatment, synthetic fibrin mesh models with specific connectivity distributions. They want to compare the physical behavior of these hypothetical models with experimental data, both to validate and improve the models and to predict how changing the experimental conditions will affect future measurements.
To support this hypothesis testing, we develop simulation tools that can be coupled to our visualization and analysis workflows. Sometimes, sufficiently fast and accurate simulations are available off the shelf; at other times we must extend them to meet collaborators’ needs. This project has the following goals:
- Network Extraction: Enable automatic and scriptable calculation of numbers of branch points from network structures in time series of large 3D confocal microscopy images.
- Lattice-Boltzmann Flow: Enable rapid and accurate fluid-structure interaction simulation that modifies flow based on boundary conditions and modifies flexible boundaries based on the flow.
- Coarse-Grained Thermal Simulation: Enable rapid and accurate estimation of the behavior of linked chromatin and protein structures in the presence of thermal forces from the surrounding fluid.
- Monolayer Stress Microscopy: Determine the stress forces that cells apply to a substrate by observing two-dimensional displacements of particles embedded in the substrate.
Advanced Visualization
The difficulty with toolkits like the open-source Visualization ToolKit (VTK) from a scientist’s point of view is rather like the difficulty a computer scientist would have if given free access to an automotive shop: all the tools needed to fix a car are in there somewhere, but knowing which tools to use and how is beyond their experience. Our aim is to provide tools that are optimized to answer the specific questions posed by our collaborators in the belief that a tool that solves a particular problem is more likely to be of broader usefulness than a “generic” tool that is not optimized for usefulness on any particular problem. This requires drawing on an understanding of the available techniques, the characteristics of the human visual system, the characteristics of the data sets, and the questions being asked.
Our collaborators continue to provide data sets and questions that push the state of the art in 3D visualization. Problems generated from Radiology colleagues have produced two computer-science dissertation topics and tools of use for both micron-scale and organ-scale data sets. We have four ongoing projects in this area, with the longest-running one (ImageSurfer) maturing into a visualization and analysis tool and the two newest ones (nDive and FOR) providing publications and novel views into biomedical and microscopy data sets. We also maintain an information page letting biomedical researchers know how to set up stereo displays in their own lab.
3D Scalar Volume Visualization: ImageSurfer