Video Spot Tracker Tutorial: Magnetic Bead Calibration
Data Set and Source
This data is from Jay Fisher at Richard Superfine’s laboratory at the University of North Carolina at Chapel Hill. The .raw file was captured at 120 frames/second on a Pulnix camera read through an EDT board; it stores the 8-bit monochrome frames in binary format. It shows beads moving in a known-viscosity sugar solution towards a single pole within the 3DFM. It was used to calibrate the forces by calculating bead motion in response to drive currents.
Recommended Analysis Procedure
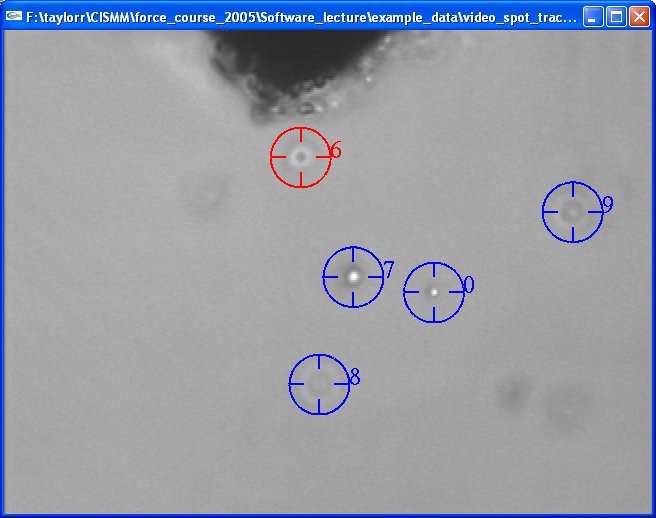
Use the default symmetric kernel to track these beads, which move in and out of focus over time. Use a radius of 15. Check the round_cursor control so that the crosses do not obscure the traces of the beads. Place one tracker on each bead (left mouse button) and then turn on optimization. Press play. As beads approach the pole tip, select them with the right mouse button and delete them using the backspace key. As new beads enter the field of view, create new trackers to follow them using the left mouse button; wait until the beads are well within the boundary before tracking them. Watch the beads to make sure they stay in focus enough and away from the borders; delete those that are in danger of losing tracking.
You can also use the lost_tracking_sensitivity control to avoid having to pay attention to the beads; it will pause the tracking if a bead becomes too difficult to distinguish.
 The resulting tracking will look something like this:
Note that neither the cone nor the disc kernel would be able to track all of the beads shown in this image, with either the bright or dark spot choice. The symmetric tracker was created for this case, where the characteristics of the different beads vary widely but they are all circularly symmetric.