ImageSurfer 2: Volume Rendering
This tutorial teaches you how to do Volume Renderings (VRs) in ImageSurfer 2.
We will be using the dendritic spine data set as the example. This tutorial shows you how to load data in ImageSurfer.
Rendering
Once the data is loaded, you will see a white wireframe of a 3D box in the display area. The wireframe is the default ‘Outline’ representation, and it shows where the data boundaries are. Now we are going to change the representation to ‘Volume Rendering’.
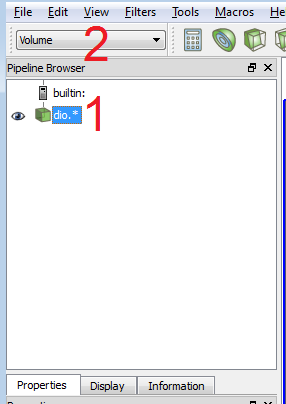
- Click on
dio.*in the Pipeline Browser to select it. - Change representation from
OutlinetoVolumein drop-down list on top.
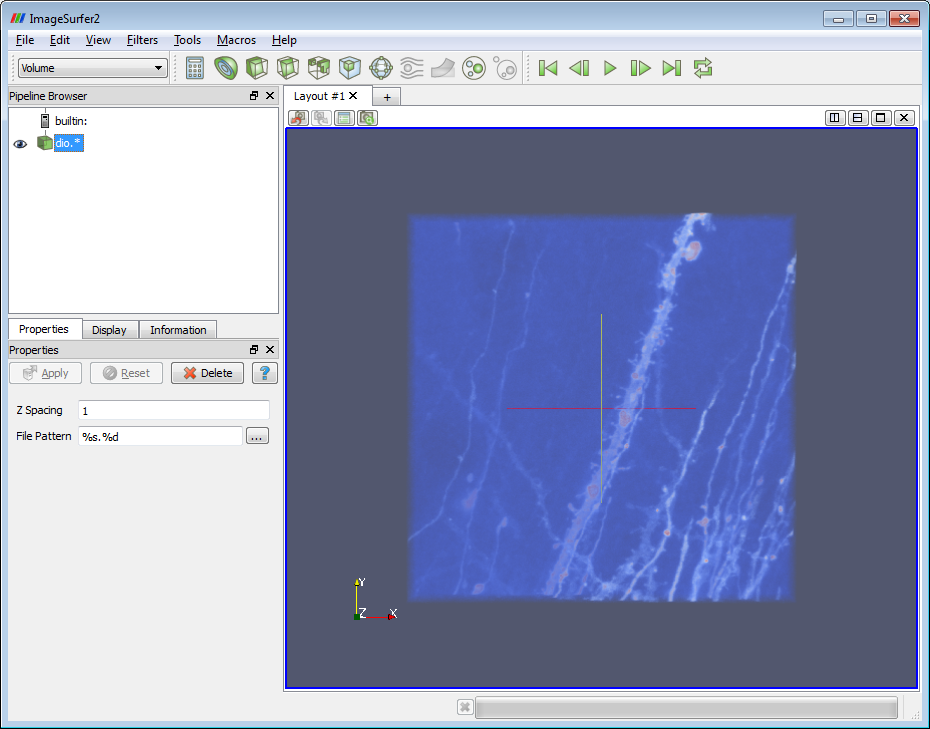
After a moment, the outline box should change into a volume rendering, as the picture below.
Volume Rendering Editing
Before starting showing you how to use the editors, let’s get some knowledge about volume rendering. What you see in the display area is actually a crowded area full of tiny voxels organized in a 3D grid. A voxel is what we call a pixel in 3D space. Each voxel has two attributes: color and opacity. You can see kind of see through the volume rendering because the voxels are not 100% opaque. The volume rendering editors in ImageSurfer 2 does nothing special but to change the colors and opacities of the voxels.
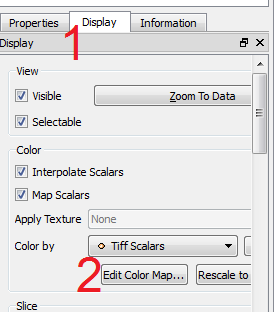
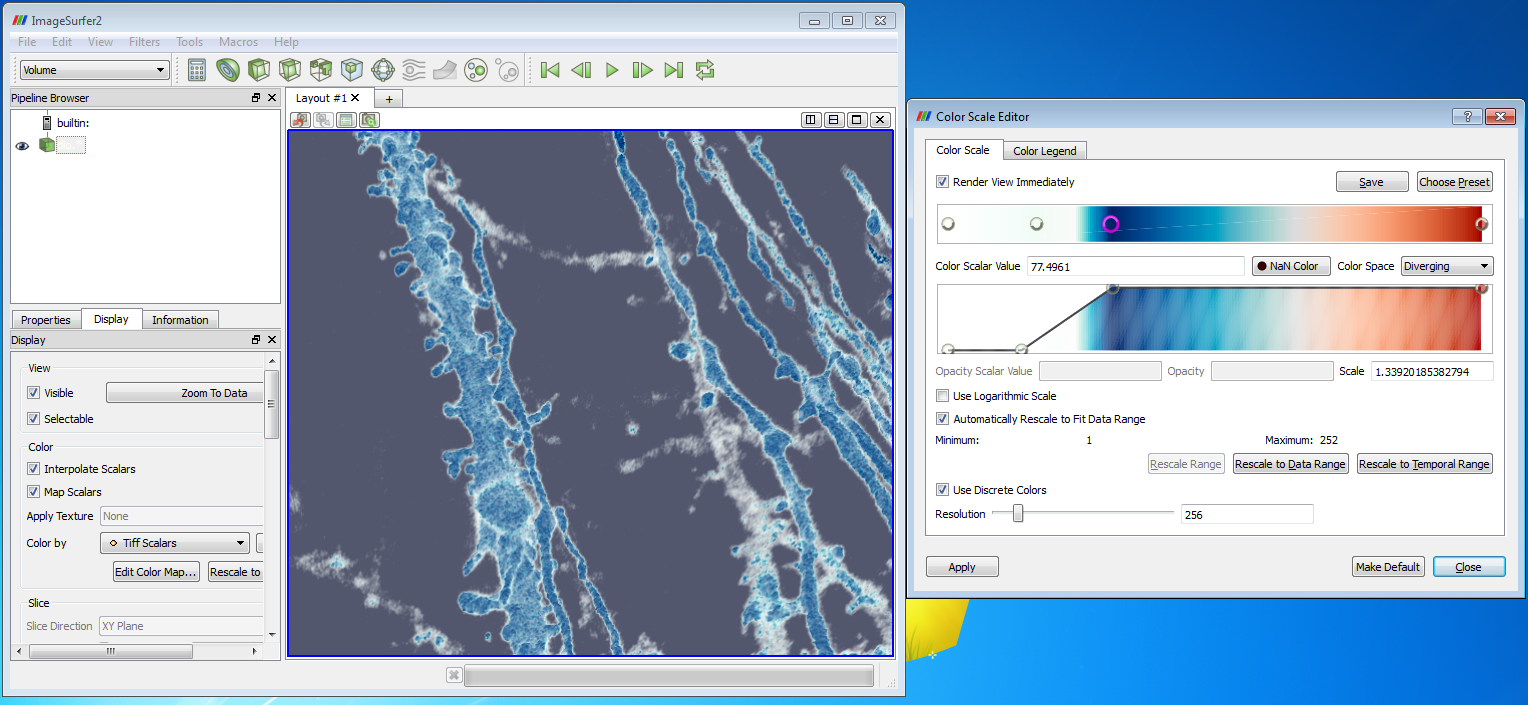
To bring up the volume rendering editors in ImageSurfer 2, switch to the Display tab, and click on the Edit Color Map… button.
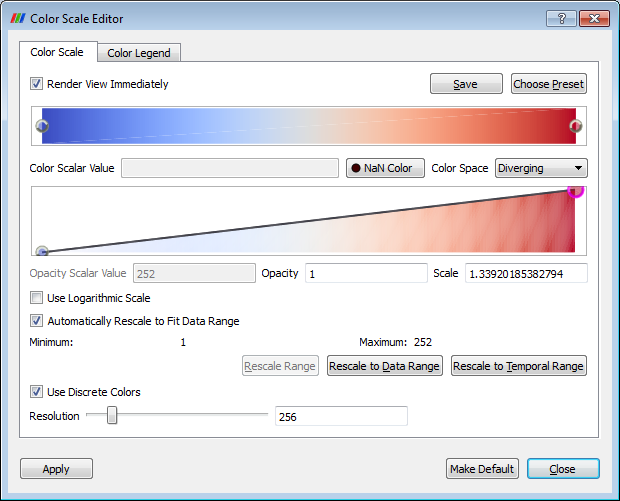
When a dialog pops up, first check Render View Immediately in the upper left corner, so any changes we make will apply automatically.
The color editor dialog contains two editors, they are the two rectangles with gradient colors in the background. The first one is the color editor. The second one is the opacity editor.
Color Editor
The color editor is one dimensional and it allows us to modify voxels’ colors. Imagine the editor itself is a ruler scale in the X-axis. The scale values are the values extracted from the data (dentritic spine image stack), with the minium at the left end and the maximum at the right end. With the gradient color in the background, each value on the scale gets a corresponding color. For example, voxels with a minium value are colored in blue by default. If we want to change a voxel’s color, we just change it’s corresponding color in the editor.
The interactions in the color editor include:
- Left mouse click: Click on an empty space creates a new node. Click on an existing node allows you drag the node to a different position, and therefore to change the gradient.
- Backspace or Delete key: Delete a selected node.
- Double left clicks: Double clicks on a selected node will allow you to change its color.
- Scroll wheel: Allows you zoom-in and zoom-out in the editor. Zoom-in is useful when the nodes get too crowded.
Notice that the two nodes in the far end in each side are not movable. They give you a hint of what the current range of voxel values is.
Opacity Editor (Transfer function editor)
The opacity editor allows us to change voxels’ opacity (alpha). It is two dimensional, with voxel values laid out increasingly along the X-axis (like in the color editor), and absolute opacity values, from zero to one hundred in the Y-axis. Each voxel’s opacity is determined by a transfer function, which is the black line within the opacity editor mapping voxel values to opacity values. We adjust the transfer function to change voxels’ opacity in a volume rendering. Notice that the gradient background in opacity editor cannot be changed. You have to use color editor to change color assignments.
both having a gradual color shifting background. The top one controls voxel colors, and the bottom one controls voxel opacities. Let’s look at the top one first. Use your left mouse to click on any place of the scale to create a new node. You can drag the node horizontally. Notice that when the node is at a different location, it will in turn to change the volume rendering. If you cannot see the volume rendering windows, move the transfer function dialog away, so it doesn’t block the rendering window underneath . This editor is one dimensional and the voxel values lay out increasing from left to right along the X-axis. In this example, the values are from the DiO data set. The color background defines which value maps to which color. Changing the color background by adding nodes and moving them around allow the user to define a costumed color mapping.
Interactions to modify the transfer function:
- Left mouse click: Click on an empty space creates a new node. Click on an existing node allows you drag the node to a different position, and therefor to change the transfer function.
- Backspace or Delete key: Delete a selected node.
- Double left clicks: Double clicks on a selected node will bring up four more control points around the node (up, down,left, and right) as green dots. Moving the left and down control points changes the transfer function only between the selected node and a node before it. Moving the right and up control points changes the transfer function only between the selected node and a node after it. It’s easier to select those control points if you first increase the whole dialog’s size.
- Scroll wheel: Allows you zoom-in and zoom-out in the editor. Zoom-in is useful when you have crowed nodes.
Notice that the two nodes in the far end in each side cannot be moved in X direction. They give you a hint of what the current range of voxel values is.
Practical Example
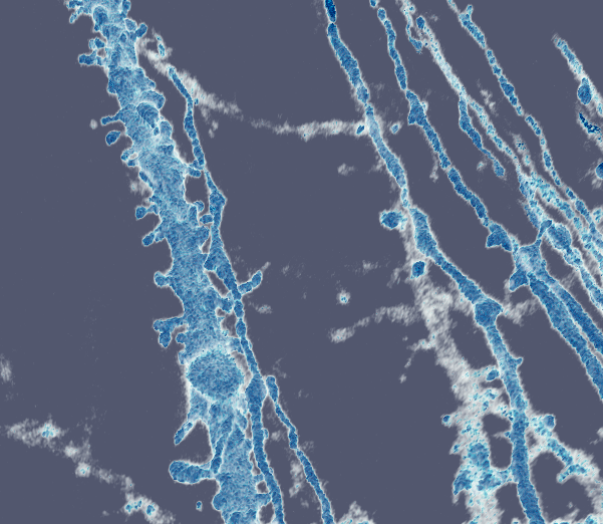
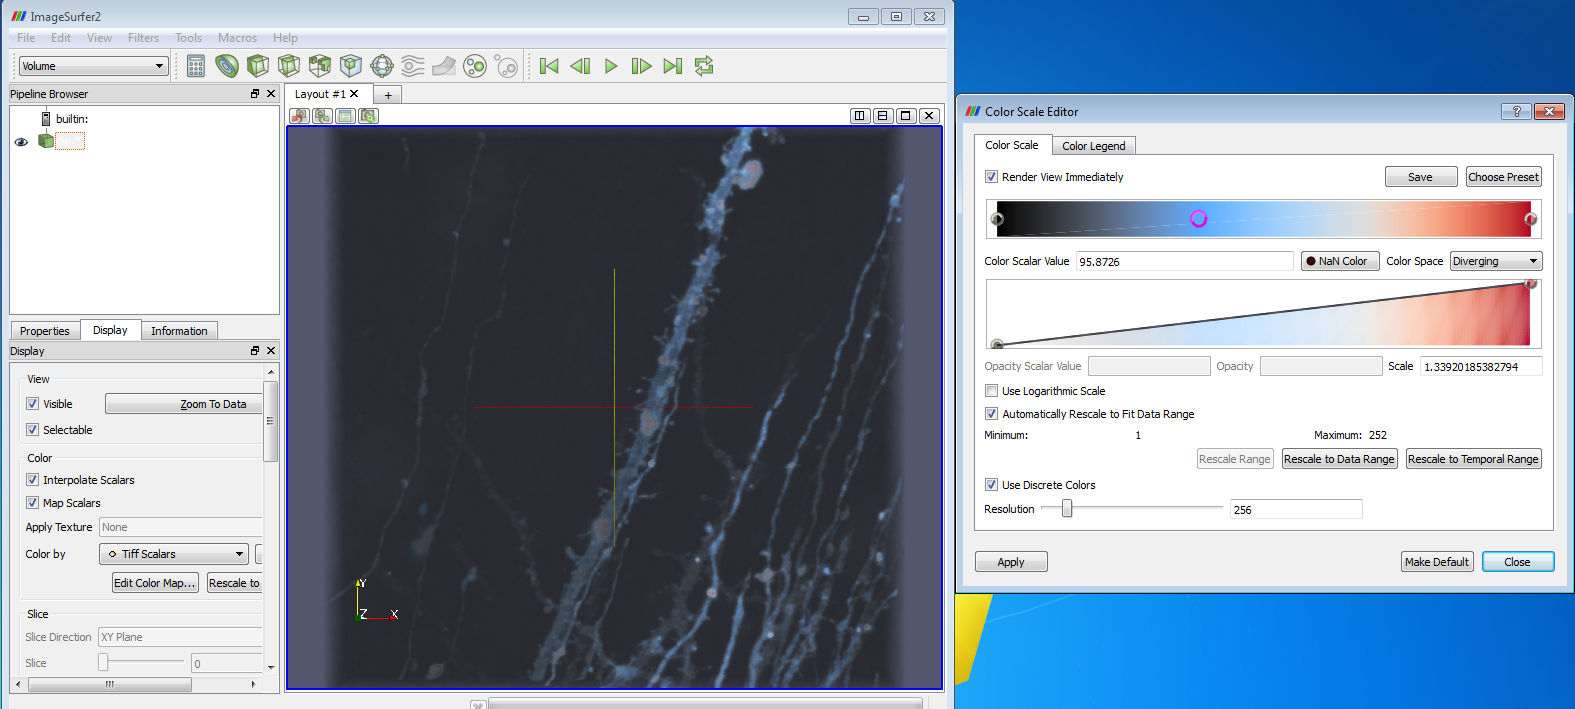
Take the DiO data set for example, say we want to get rid of the mist of blue, which is noise that we have no interest to see. According to the color editor, blue means low values. What we can do is to change the left boundary node to black, and then to add a blue node in the middle to highlight the shape of the dendritic spine. See the picture below
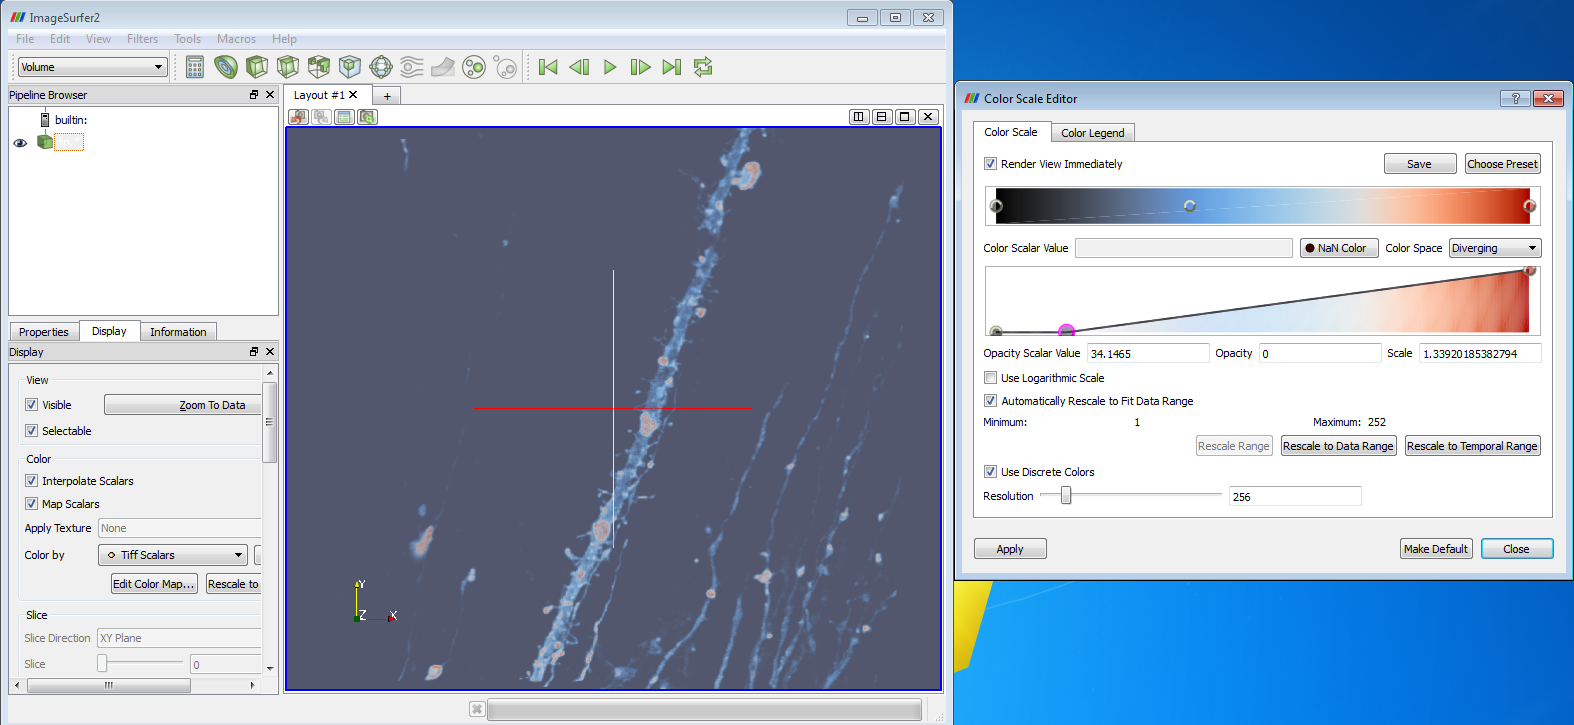
To completely get rid of the noise, we create a node in the opacity editor and drag it all the way down to the bottom to assign zero opacity to voxels with low values. See the picture below.
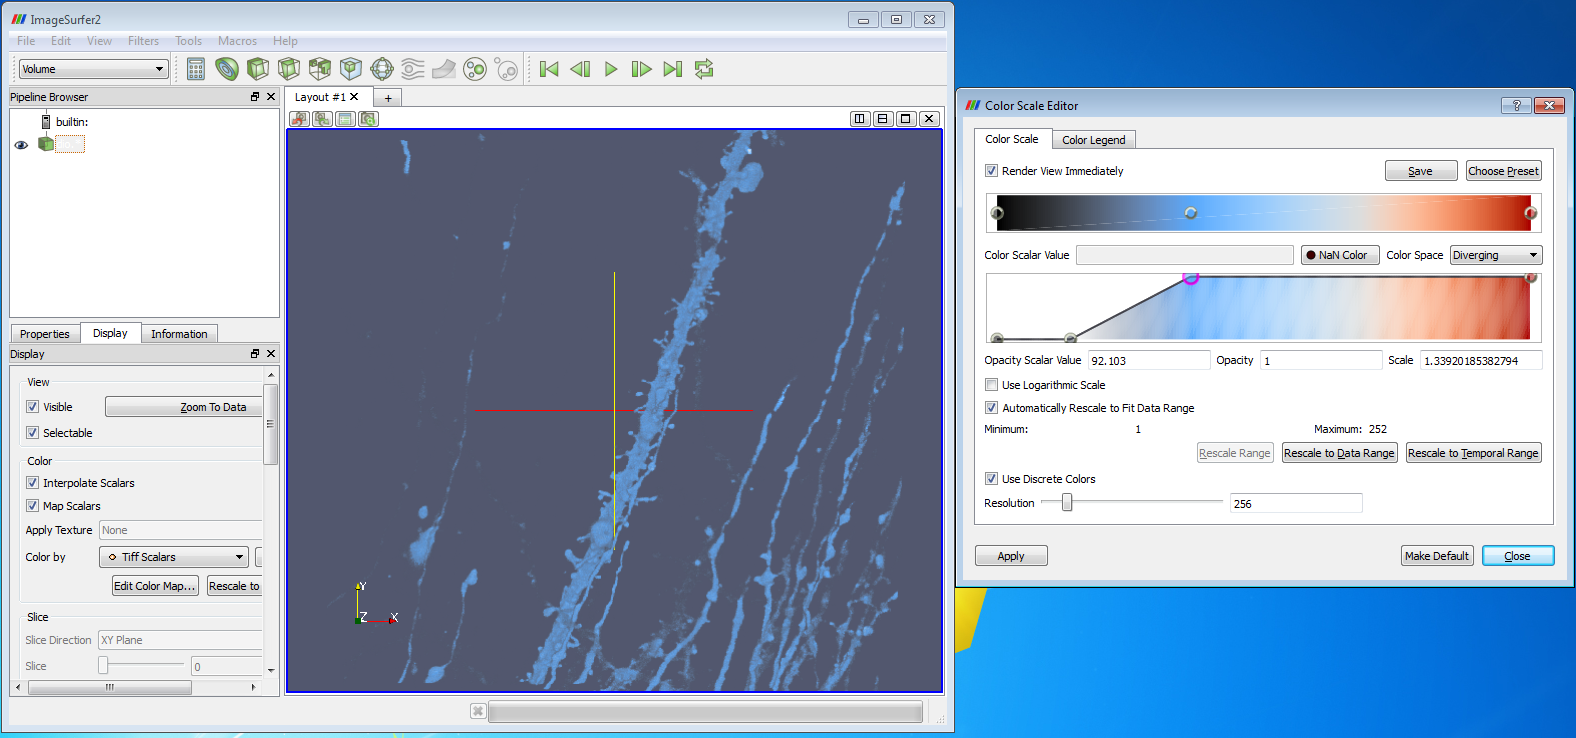
To better see the shape the dentritic spine, a sharp jump in opacity would work. We add another node in the opacity editor as in the picture below. In this case, all the voxels having values between the third node an the fourth node are 100% opaque, which makes the blue volxels more visible, but it also makes them block the red voxels behind them. You can see that by comparing the picture below and the previous picture.
Finally, to highlight the boundary of the spine, we assign the boundary voxels white color by adding a white node in color editor, and give the gradient a sharp color transition from white to blue. To reproduce the result:
- Change the left color boundary node from black to white.
- Add another white color node between the left boundary node and the second node.
- Change the third node to dark blue
Related representations
One drawback of volume rendering is that it’s difficult to see the surface details. Isosurface and Directional Illumination rendering on the other hand are better on this task.