ImageSurfer 2: Color a dataset with values from another dataset
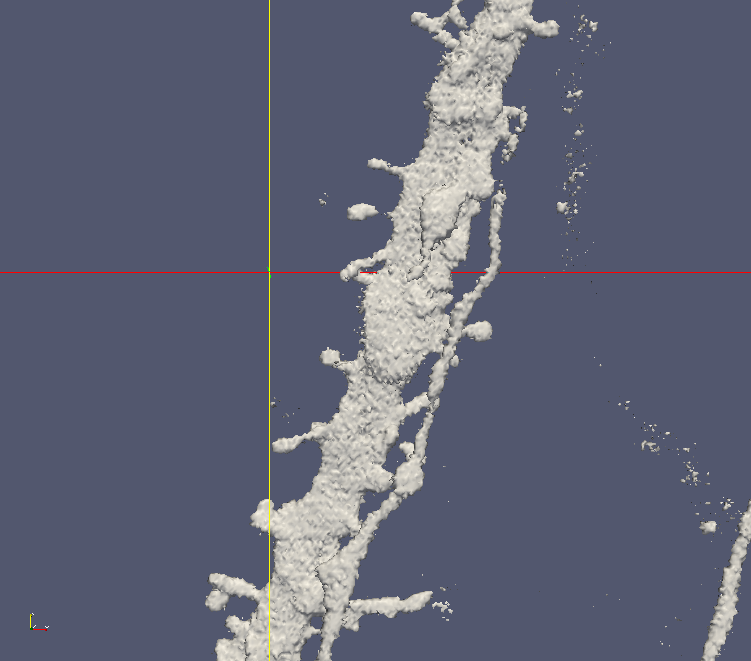
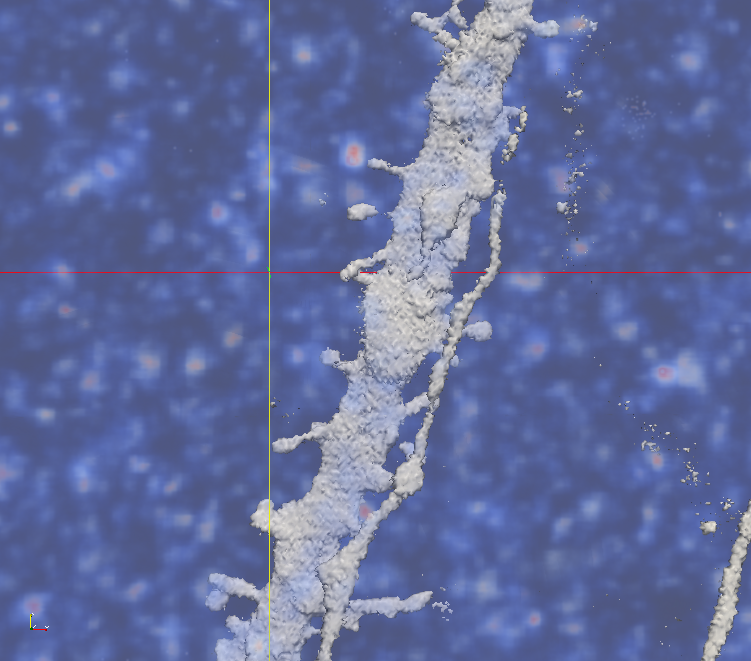
 This tutorial shows you how to blend colors on one dataset’s surface based on the values from a second dataset in the same space. A good example would be using a color map to present air pressure on an airplane’s surface. The images above was created using this technique to visualize where the calcium is high on the surface of dentritic spines.
- Follow this tutorial to load the dentritic (dio) and calcium (pmca2) example dataset.
- The calcium (pmca2) is the immersive environment where the dentritic spine (dio) is. We want to probe the environment values based on the geometry of the spines. In the Pipeline Browser, select one of the two dataset, and click Filters->Alphabetical->Resample with Dataset.
- In the next dialog, first click the ‘Input’ radio button on the left, and select ‘pcma2.*’ to the right. Next, click the ‘Source’ radio button, and select ‘Contour1’ under ‘dio.*’ to the right. The names might be a little confusing. ‘Input’ means the environmental dataset where we are going to probe values from. ‘Source’ means the geometry in space whose outline we want to preserve.
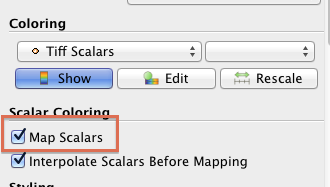
- After applying the Resample with Dataset filter, check ‘Map Scalars’ to apply the values to a color map.
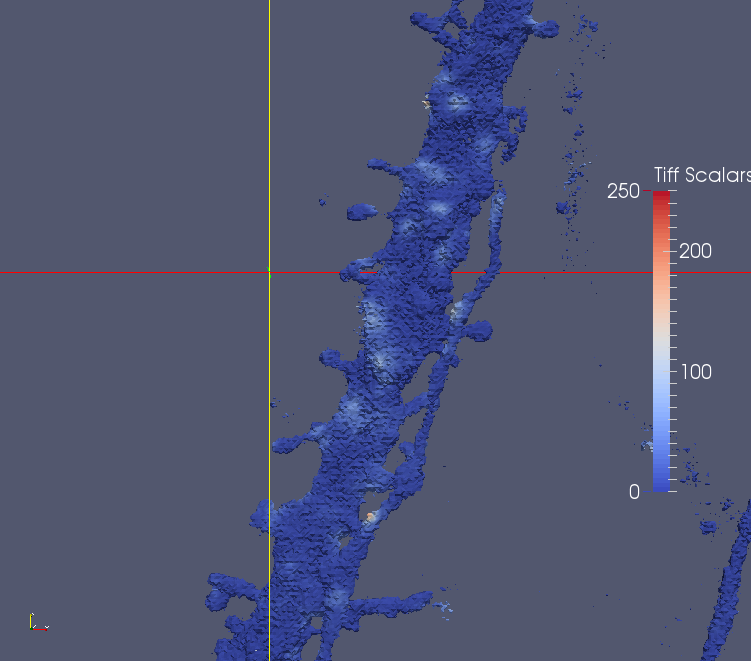
 you should be able to see the colored surface, with white and red spots indicating where calcium is high on the geometry.