3DFM User Interface
The user interface and control system for the 3D Magnetic Force Microscope (3DFM) mediates access to experiments for all scientists who use the system. It both enables control over instrument parameters and displays the combined results from the several instrument subsystems. This controls three real-time systems running across four computers to provide a synchronized, coherent display and control interface.
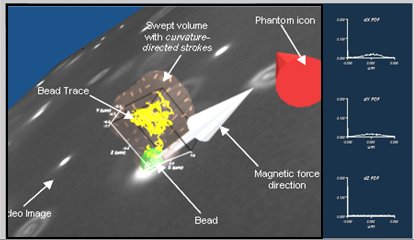
The figure to the right shows a portion of the user interface. It is annotated with labels describing different portions of the 3D interface. The panel to the right shows histograms of bead motion.
The 3D display (shown here in monoscopic view but also displayable in stereo) displays the current location of a tracked bead as a green wire-frame sphere. This sphere is centered in the live video display of 2D microscope data (the gray plane with white spots surrounding the sphere in the image). This plane of video moves with the bead through the volume and shows objects in the specimen that lie on or near the focal plane passing through the bead. The sphere leaves a yellow line as a trail, showing where the bead has moved during an experiment. This line can be
colored based on viscosity or another scalar field. A transparent shell is also drawn around the volume that has been “carved out” by the bead as it has moved along the trace; this shows the boundary of the region explored by the bead. Opaque strokes on this surface that lie along directions of principal curvature help the region’s shape and locality be clearly seen (Interrante 1996).
This interface has been successfully used to enable experiments that measure viscosity in mucus and on cells, that track beads on live, moving human cilia, and that apply forces to beads linked to specific membrane proteins on cells.(Fisher 2005; Fisher 2006; Fisher 2006; Fisher 2007; Desai 2008; Hill Submitted) It enables the real-time visual display of the path of the bead, a visual indication of the viscosity (not shown in the figure), and the display of live 2D video data.