Video Spot Tracker Tutorial: Rod-shaped Bacteria Tracking
Data Set and Source
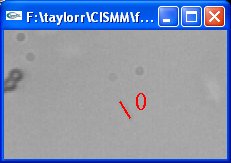
This data set was provided by David Hill from Richard Superfine’s laboratory at the University of North Carolina at Chapel Hill. It shows a bacteria undergoing diffusion within 2.5 percent mucus. The bacteria is the dark sliver slanted at about 30 degrees left of vertical near the middle of the image. There are also beads moving near the left edge and a couple of lens spots that don’t move. The video is cropped in space and time to include only a portion of the total experiment.
Recommended Analysis Procedure
Use a rod3 kernel with a dark cone to track the bacteria as it moves, adjusting the orientation and position to match before starting optimization. The default length of 20 and radius of 5 should work. Turn on optimize. The tracking window should look something like this:

Press play_video. The trackers should follow the rod as it moves in the image. If you turn on show_debug, you can see how well-localized the rod is along its length, and how well the rod is kept centered in the view of the tracker.