Video Spot Tracker Tutorial: Kymograph
Data Set and Source
This data set is provided by Erin McCarthy at Bob Goldstein’s laboratory at the University of North Carolina at Chapel Hill. It shows a cell undergoing mitosis and has clearly labeled spindle poles and chromosomes.
Recommended Analysis Procedure
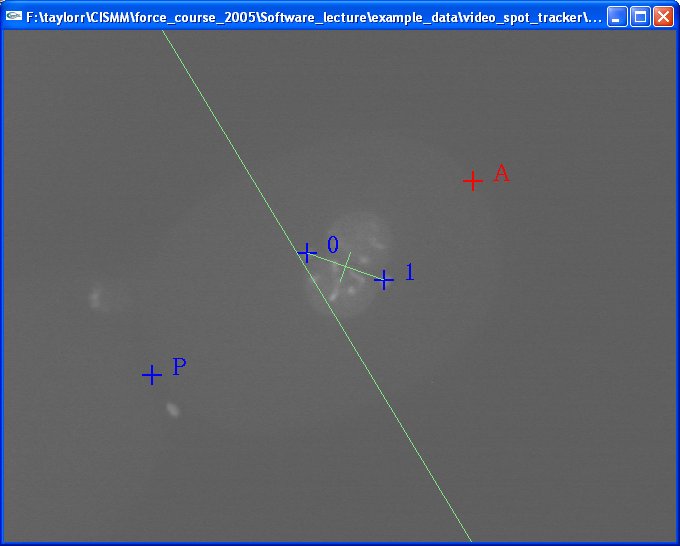
These images are 16-bit TIFF files whose intensities go above 255. To better see the images, adjust the brightness slider to a value between 9 and 10, or click on the “8” and enter 9 into the dialog box. Set the tracking kernel to a 10-pixel radius cone and turn off the dark_spot control. Select the kymograph control, which will cause two new windows to appear. Place four trackers; the first two on the spindle ends and the next two on the posteroir and anterior ends of the cell (I do not know if these are reversed in the image below):

The Posterior and Anterior markers are not optimized; they stay at the same location in the image and are used to demarcate the cell axis. The long green line that cuts entirely across the image shows the halfway point between these markers and forms the centerline on one of the two kymograph images. The 0 and 1 markers move over time to track the spindle, and the green cross between them indicates spindle-centered coordinates. The centerline moves to stay halfway between the spindle ends, and the orientation also tracks spindle motion. The point where they cross forms the center of the kymograph display and the second axis is rotated to form the X axis in the window. The Y axis in the kymograph window is time.
Turn on the optimize checkbox. Press play_video to commence tracking. The resulting spindle-centered kymograph will look something like this:
