ImageSurfer 2: Extract Fibrous Structures
 Hessian Filter
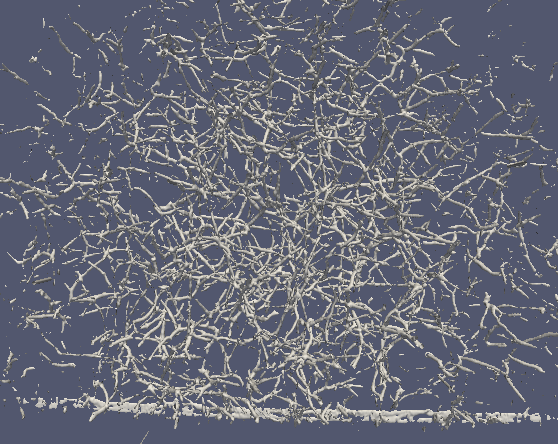
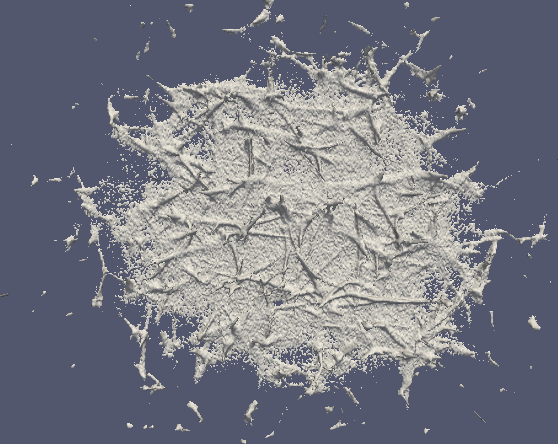
This tutorial shows you how to use the Hessian filter in ImageSurfer 2 to isolate the fibrous structures from the background noise. We are going to use this data as an example.
- Download and extract the data file to a local drive.
- Open ImageSurfer 2, click on File > Open to load the extracted file ‘stack21_G7_1mg_1U_55_25um_neg1step.vtk’.
- Click
 in the ‘Properties’ Panel to confirm loading.
 - From the very top menu, click Filters > Alphabetical > Hessian 3D To Vesselness Measure Image Filter. Now the windows should look like this:
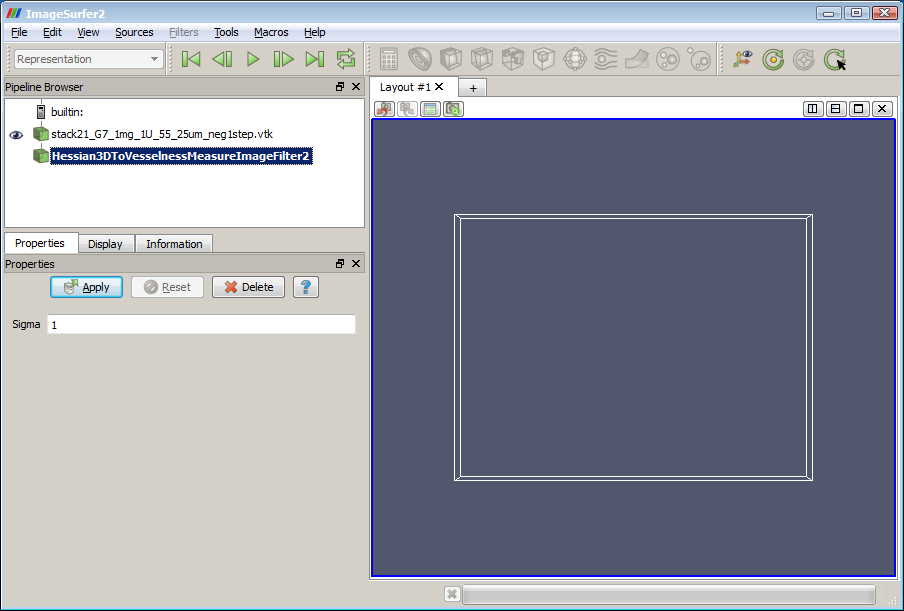
- Change ‘Sigma’ from 1 to 0.8, and click the button again.
- Click the ‘Contour’ icon
 from the very top toolbar. Change the value in ‘IsoSurfaces’ from 133.18483 to 7. The windows should look like:
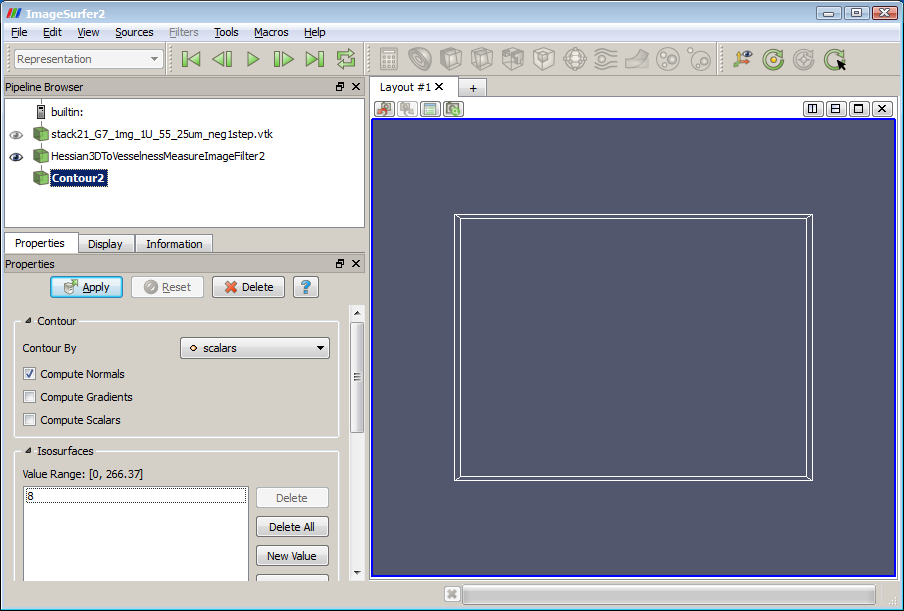
- Next, click the button again. The plasma clots should now appear as in Picture 2.
Working with your own data
Here are a few tips when you work on your own data file:
- In step 8, the Sigma value determines the thickness of the outcome structure. The higher the value, the thicker the structure. An appropriate value differs from sample to sample. What we usually do is first use the default value of 1 to get a glance of the model, and then experiment with different Sigma values to see which value generates the best model.
- When you change the Sigma value, the first thing you’ll notice is that the amount of data being displayed is changed (more structures show up, or existing structures disappear). A higher Sigma value will result in less data, while a lower Sigma value will result in more data. The Isosurface value in step 6 controls how much data to display. A lower isosurface value shows more data, and a higher isosurface value shows less data. Take this tutorial for example, if we change Sigma from 0.8 to 1 in step 5, there will be less structure in the outcome. We’ll have to lower the Isosurface value from 8 to 5 to make most of the structures show up.