MR Spectroscopy for Tumor Detection
In recent years the use of MR spectroscopy and perfusion data has added new insight into abnormalities found in traditional MRI scans. Identifying the chemical composition and blood flow activity in and around areas of abnormal growth provides doctors with an improved understanding of the shape and severity of the growth (Henson 2005; Kwock 2006; Pivawer 2007). Current methods for visualizing spectroscopy and perfusion data are limited. With perfusion data, simple 2D color maps are used to highlight areas of increased or decreased blood flow. A few attempts have been made to visualize the correlation between perfusion data and anatomy (Kao 2003; d’Arcy 2006; Chang 2006 ), but they are limited to two dimensions. Visualization of metabolite concentrations from spectroscopy data faces similar limitations. Many of the techniques used only allow for the representation of the ratio of one metabolite concentration to another (Kwock 2006). These techniques use a simple 2D color map. Other methods simply display the MRSI spectrum for each scanned voxel individually (Henson 2005; Pivawer 2007). As combining data from various types of MR scans improves diagnosis and treatment, we must develop a method for simultaneous multi-dimensional visualization of these data sets.
Effective display of relative metabolite concentrations is needed to effectively perceive tumor boundaries during treatment planning, to determine treatment effectiveness, and to track changes in tumors over time. The simultaneous display of multiple metabolites is crucial for the development of hypotheses about which metabolites (and correlations between metabolites) indicate healthy and abnormal tissue in brain, lung, and prostate.
Results to Date
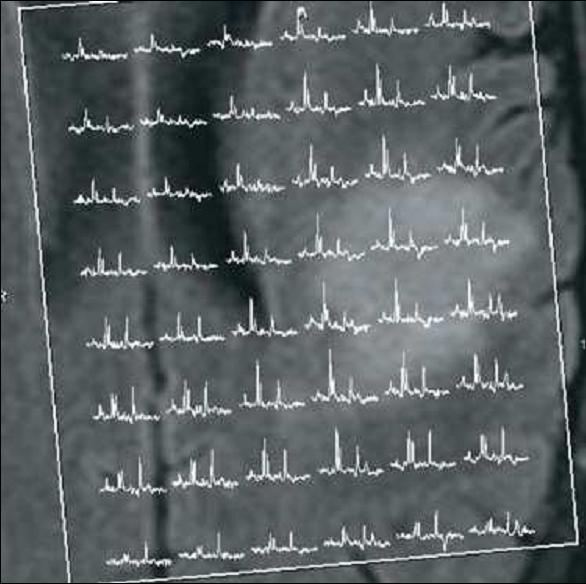
UNC radiologists capture both standard anatomical brain imaging sequences and MRI spectra with a 3D chemical shift imaging (CSI) sequence using a Siemens Allegra 1.5T MRI scanner. Each acquisition session lasts approximately 6 minutes. The raw spectroscopy data consists of per-voxel metabolite spectra in which different spectral peaks correspond to different metabolite concentrations. The metabolite spectra are sampled at a voxel size of approximately 1cm3, with resolutions on the order of 20x20x10.
Of these metabolites, up to five of them may be of interest for a particular patient. Attached to the spectroscopy data is a data subset that contains the error associated with values from the spectroscopy peaks used to identify the concentration of a given metabolite.
Center Impact
This collaboration relies on the development of effective display techniques within the Resource, including:
- Display of correlations between multiple volumetric scalar fields
- Quantitative and qualitative display of values in volumetric scalar fields with uncertainty
- Comparison of two (before and after) volumetric scalar field data sets.
Collaborators:
Yueh Z. Lee, Adjunct Assistant Professor, Department of Physics and Astronomy, University of North Carolina, Chapel Hill.
Funding: UNC Radiology. Proposal in preparation for PAR-07-417 (R03).
Lester Kwock, Professor of Radiology, University of North Carolina, Chapel Hill, NC.
Funding: UNC Radiology