Fast Microscope Simulation
The Challenge
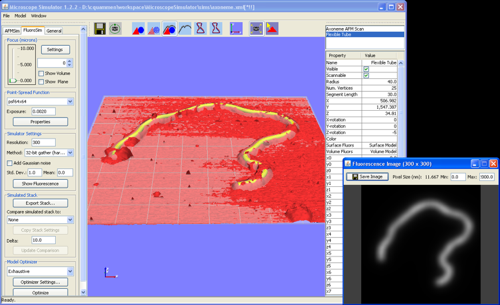
Common types of microscopes used in nanotechnology research exhibit strong imaging artifacts that make analysis of experimental results challenging. To help scientists better understand the imaging artifacts, we are developing the Microscope Simulator, an interactive tool to aid scientists who use fluorescence or atomic force microscopes (AFM) to better understand their microscopes and their data. The Microscope Simulator is useful in several ways:
- For scientists lacking experience with these microscopes, the Microscope Simulator serves as a teaching tool for showing how the imaging artifacts distort images of specimens with known shape. When specimen models are manipulated interactively via the mouse, updates to the simulated images are generated and displayed in real time, enabling greater understanding of the imaging artifacts.
- Prior to conducing an experiment, scientists can use the Microscope Simulator to answer whether a microscope with particular settings can unambiguously distinguish among multiple hypotheses about the shape of a specimen or whether a different imaging modality is required. Performing this kind of analysis prior to carrying out actual experiments can save time, money, and frustration.
- When trying to understand the geometry of a specimen, the Microscope Simulator can show how well a hypothesized geometric model explains the image taken by a real microscope. Interactive model adjustment enables the scientists to quickly evaluate “what if” scenarios by interactively changing the specimen model geometry and observing how the adjustment improves or degrades the explanatory power of the model.
The Approach

The Microscope Simulator takes advantage of massively parallel commodity graphics processing units (GPUs) to rapidly synthesize images according to microscope image formation models. For simulating atomic force microscopes, GPU-accelerated gray-scale dilation computes artifacts from the scanning tip. For simulating fluorescence microscopes, we have implemented several GPU-accelerated algorithms for computing the convolution of a geometric specimen model with the point-spread function of the microscope.
The Microscope Simulator is capable of generating images from arbitrary geometric models represented by triangle meshes. Specimen models can be created from built-in primitive shapes such as spheres and tubes or imported as OBJ or PLY files created in an external modeling program.
Results
Mitotic Spindle Modeling. Kerry Bloom’s lab in the UNC Department of Biology studies mechanisms involved in the dynamic interaction between DNA and the mitotic spindle, a structure used to ensure that each cell gets a copy of DNA during cell division. We have built a geometric model of the hypothesized mitotic spindle structure as a plug-in for the Microscope Simulator. Comparing images of this structure taken in the lab to images created by the Microscope Simulator provides evidence that their model is correct.
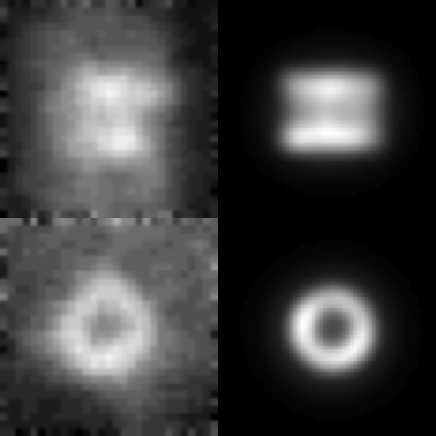
Experimental and simulated images of DNA in the mitotic spindle in yeast. Top images: Experimental and simulated images of the mitotic spindle in the side-on orientation. Bottom images: Experimental and simulated images of the mitotic spindle in the end-on orientation. |
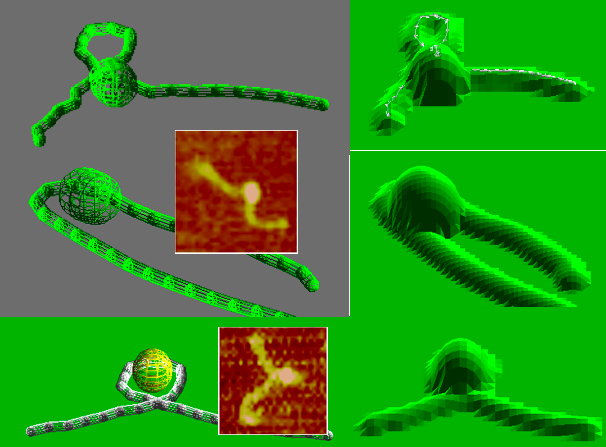
Lac Repressor Acting on DNA. Dorothy Erie’s lab used atomic force microscopy to study the conformation of DNA in relation to the lac repressor. Three potential configurations of DNA are shown on the left below. Examples of configurations from real scans are inset in the corresponding model images. Using the AFMSim module of the Microscope Simulator, Erie was able to estimate the radius of the tip used in her experiments. Generating simulated scans of the proposed model configurations with the determined tip radius, Erie determined that the top model configuration should be visible in an AFM. Because she did not observe this shape in experimental scans, she concluded that this configuration was not likely to occur in nature.
Current Project Members
Cory Quammen, Graduate Research Assistant, Department of Computer Science
Russell M. Taylor II, Research Professor, Department of Computer Science
Richard Superfine, Bowman and Gordon Gray Professor, Department of Physics and Astronomy
Collaborators
Kerry S. Bloom, Thad L. Beyle Distinguished Professor, UNC Department of Biology
Julian Haase, UNC Department of Biology
Benjamin D. Harrison, Graduate Research Assistant, UNC Department of Biology
Dorothy Erie, Professor, UNC Department of Chemistry
Research Sponsors
NIH National Institute for Biomedical Imaging and Bioengineering (NIH P41 EB002025).
Selected Presentations of this Work
Quammen, C., A.C. Richardson, J. Haase, B.D. Harrison, R.M. Taylor II, and K.S. Bloom. FluoroSim: A visual problem-solving environment for fluorescence microscopy. In C. Botha, G. Kindlmann, W. Niessen, and B. Preim, editors, EuroGraphics Workshop on Visual Computing for Biomedicine, pages 150–158, Oct. 6-7 2008.
Yeh, E., J. Haase, L.V. Paliulis, A. Joglekar, L. Bond, D. Bouck, E.D. Salmon, K.S. Bloom. The path of centromere DNA. Cover image, Current Biology, 18(2) Jan. 22, 2008.
Quammen, C. and R.M. Taylor II. Using instrument simulation to quantify experimentation. Poster presentation, Microsoft eScience Workshop at RENCI, page 107, Chapel Hill, NC, October 21-23, 2007.
Varadhan, G., W. Robinett, D. Erie, and R.M. Taylor II. Fast simulation of atomic-force-microscope imaging of atomic and polygonal surfaces using graphics hardware. In R. F. Erbacher, P. C. Chen, M. Groehn, J. C. Roberts, and C. M. Wittenbrink, editors, Proc. SPIE Vol. 4665, p. 116-124, Visualization and Data Analysis 2002.
Keywords
Fluorescence microscopy; atomic force microscopy; hypothesis testing; biology; mitotic spindle; spindle dynamics; mitosis; cell division; DNA; lac repressor
For More Information
Dr. Russell M. Taylor II or Dr. Richard Superfine
Phone: (919) 962-1701 or (919) 962-1185
Fax: (919) 962-1799 or (919) 843-7308
E-mail: taylorr@cs.unc.edu or rsuper@physics.unc.edu