EVE for Microscopy
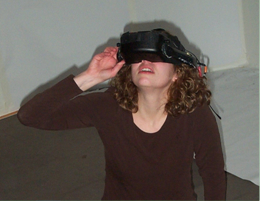 We periodically have existing and potential collaborators view their data sets using the CISMM head-mounted display and a wide-area tracker. The image to the right shows one of our collaborators, pathologist Alisa Wolberg, walking through a fibrin clot. There are two small screens, one for each eye, inside the apparatus she’s wearing. The apparatus has a tracking device on top of it that lets us know where she’s looking.
Still images from several data sets are below, along with descriptions of the data sets and the scientific results (when obtained) from this novel viewing.
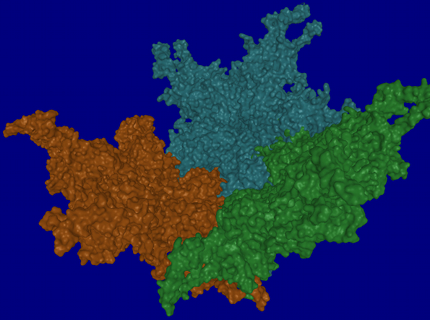
December 2009 – March 2010: Barry Kesner, Jude Samulski, Aravind Asokan and other lab members, in three viewing sessions, viewed multiple renderings of virus protiens that Barry put together.. The first dataset contained one pentamer from each of AAV2, AAV2.1 and AAV8 (see image, below). The second dataset comprised several monomers from different viruses forming a single pentamer. From viewing these datasets in an immersive environment:
- They noted differences in the pores of each pentamer. In particular, they noted that some pores have more extensive protrusions that would act like a strainer in a drain to keep out larger things.
- They noticed gaps and overlapping regions between dissimilar pentamers. The presence of these gaps was congruous with their prior experiences about which combinations of pentamers would and would not form effective viruses.
- They were able to identify holes and hooks/fingers in the pentamer structures that serve to lock the pentamers together into a capsid.
- They were able to clarify for some group members which parts of pentamers and monomers hook to adjacent *-mers and which don’t.
- They were able to identify specific structures on the surfaces of the virus capsid.

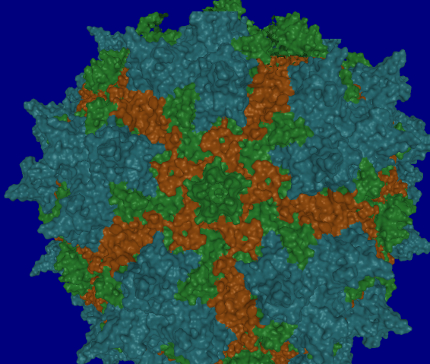
September 2009: Barry Kesner (2009 Carolina Forces in Biology workshop attendee from Jude Samulski’s lab) brought up a cartoon model of the AAV encapsulating protein (one of 60 that makes up the capsid) in Pymol and saved it in VRML format. We used Paraview to convert it to STL format and then from there into VTK format and displayed it in the HMD. Barry and several other participants from the workshop viewed the protein and were surprised at how much better it looked in the HMD than when viewed on the screen. They made plans to return with an entire capsid model and others from their lab to continue the investigation.
No particular scientific insights were gained from this viewing.
February 2009: A dendritic cell interacting with a zymosan (not shown).
Data from Aaron Neumann, UNC.
Aaron Neumann and his colleagues from Cell and Developmental Biology had looked at their data sets on the Zeiss software to view stacks, mostly using MIP and some 3D views. Using that software, they had not viewed the internal structure of the protrusions. When viewed in the CISMM immersive display, they saw the following:
- They understood the complexity in the 3D structure of the protrusions better, in particular a region that was difficult to decipher using the Zeiss software views.
- They could see that half of the little yeast bits had small dextran concentrations right next to them, some had it inside. This was very helpful to see. This viewing gave them ideas of new experiments that could be done that include time-varying stacks taken of two-color fluorescence to investigate the dendtric cell ingesting yeast-cell “nibbles”.
- They saw branching protrusions in the Dii data set, which was unexpected. They also saw a complex structure with lots of protrusions that was completely unexpected.
- Surface rendering has been especially helpful in visualizing and communicating the 3D layered structure of actin and cortactin, a promoter of actin polymerization, in the protrusions.
This viewing gave them ideas of new experiments that could be done that include time-varying stacks taken of two-color fluorescence to investigate the dendtric cell ingesting yeast-cell “nibbles”.
November 2008: A monkey lung (green), an adult female lung (blue) and a juvenile male sinus (orange).
Data from The Hamner Institute, Pacific Northwest National Laboratories.

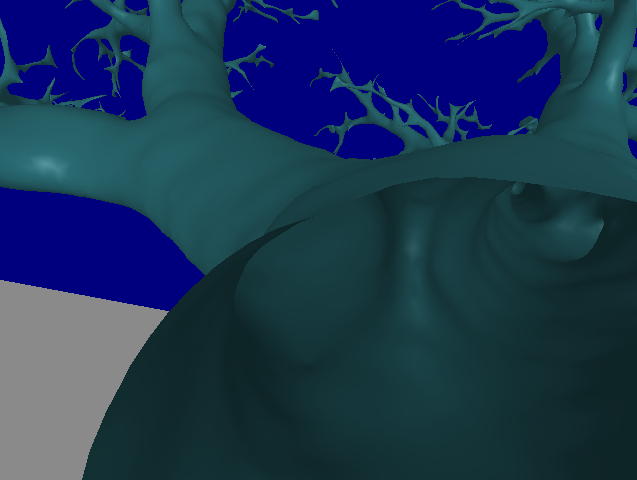
These data sets were presented to several members of the Virtual Lung group. They were able to track the branching structures of the lungs and navigate through the nasal passages in the HMD in ways that are not easily available from flat-screen views, and not available when viewing the images in movies as they had previously.
They learned the following:
- The branching structures in the lung are sometimes 3-way branches, unlike the 2D branchings used in most simulations of lung geometry.
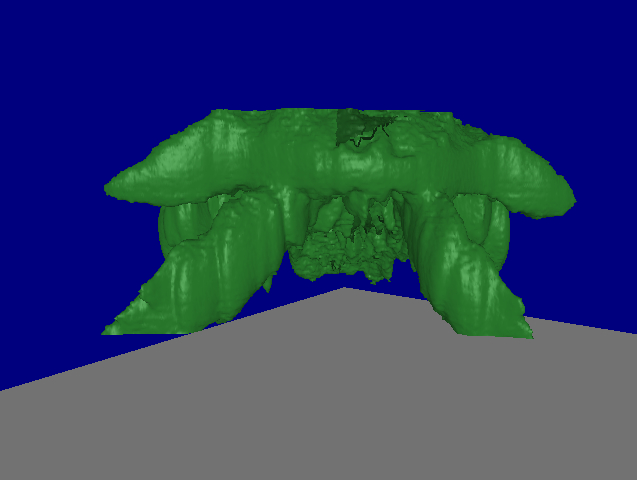
December 2008: The images below show a fibrin network (green) grown over platelets (blue). Data from Alisa Wolberg, Dept. of Pathology and Laboratory Medicine, UNC-CH.
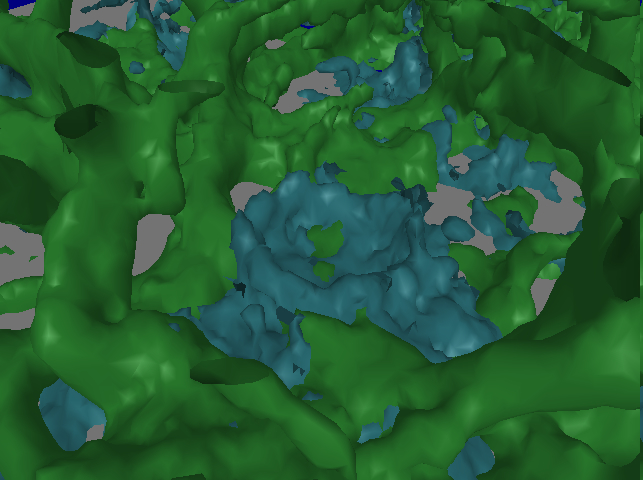
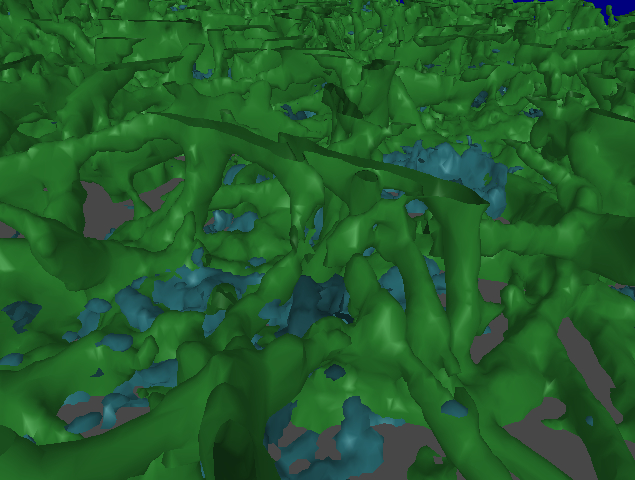
Alisa Wolberg and her colleagues studying blood clots found that, compared to their usual slice-based viewing of their data sets or monoscopic 3D rendering, the immersive interface resulted in a number of benefits:
- Most importantly, she could understand the structure of fiber crossings/branches, which was not at all apparent from the 2D slice views. In particular, she could see locations where 3 fibers were overlaid. She didn’t recognize them in the earlier 3D non-stereo views we tried in Paraview.
- It was easy to see clot heterogeneity in the HMD, which was not as apparent in the 2D slice views.
- It was also easier for her to get an idea of the overall branch density by looking at the data in the HMD.
- It was also easier to trace a fiber in the HMD than on a CRT display.
After seeing the immersive display, they commented that “We didn’t do the experiment right to answer the question about clumping… we didn’t know that these tools existed to view the data this way.”
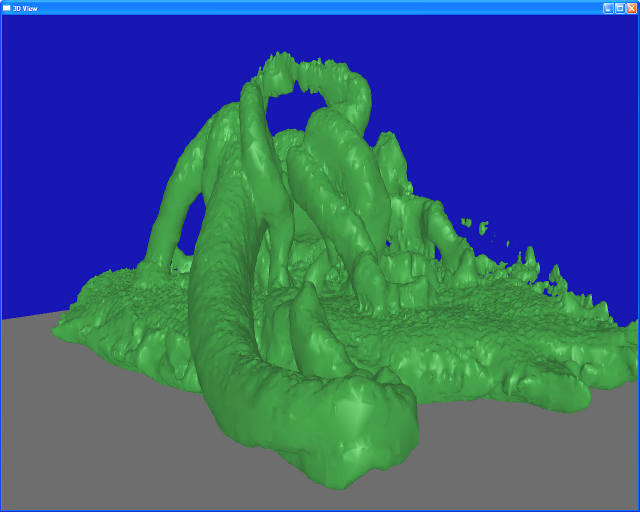
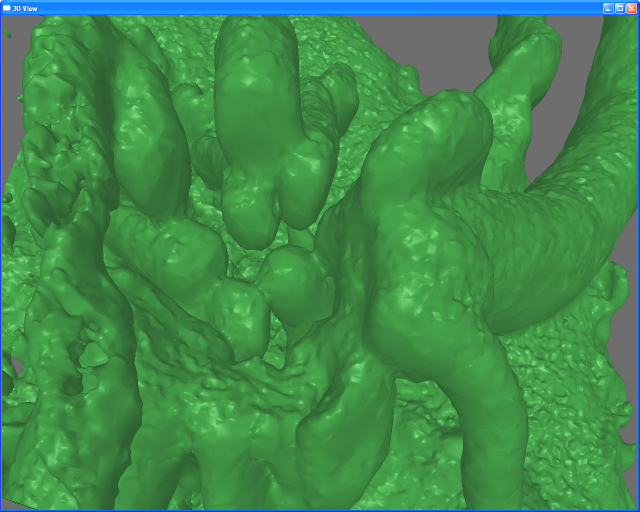
March 2008: During our 2008 Forces in Biology workshop, attendee Neeraj Gohad and his collaborators downloaded a copy of a 3D data set they had been studying. The green “bug”, is a Nauplius Larval stage of the Striped Barnacle, Balanus amphitrite. The Nauplius was labeled with DASPMI which is a mitochondrial stain and was imaged on a Zeiss LSM 510 confocal microscope. The stain emits fluorescence in the FITC wavelength.
Data from Neeraj V. Gohad, Dept. of Biological Sciences, Clemson University.
The workshop participants were quite interested in seeing the 3D structure from the inside, and expressed that it was easier to see the structure this way, but no particular scientific insight resulted from this viewing.