ImageSurfer clarifies cilia locations
July 2, 2009
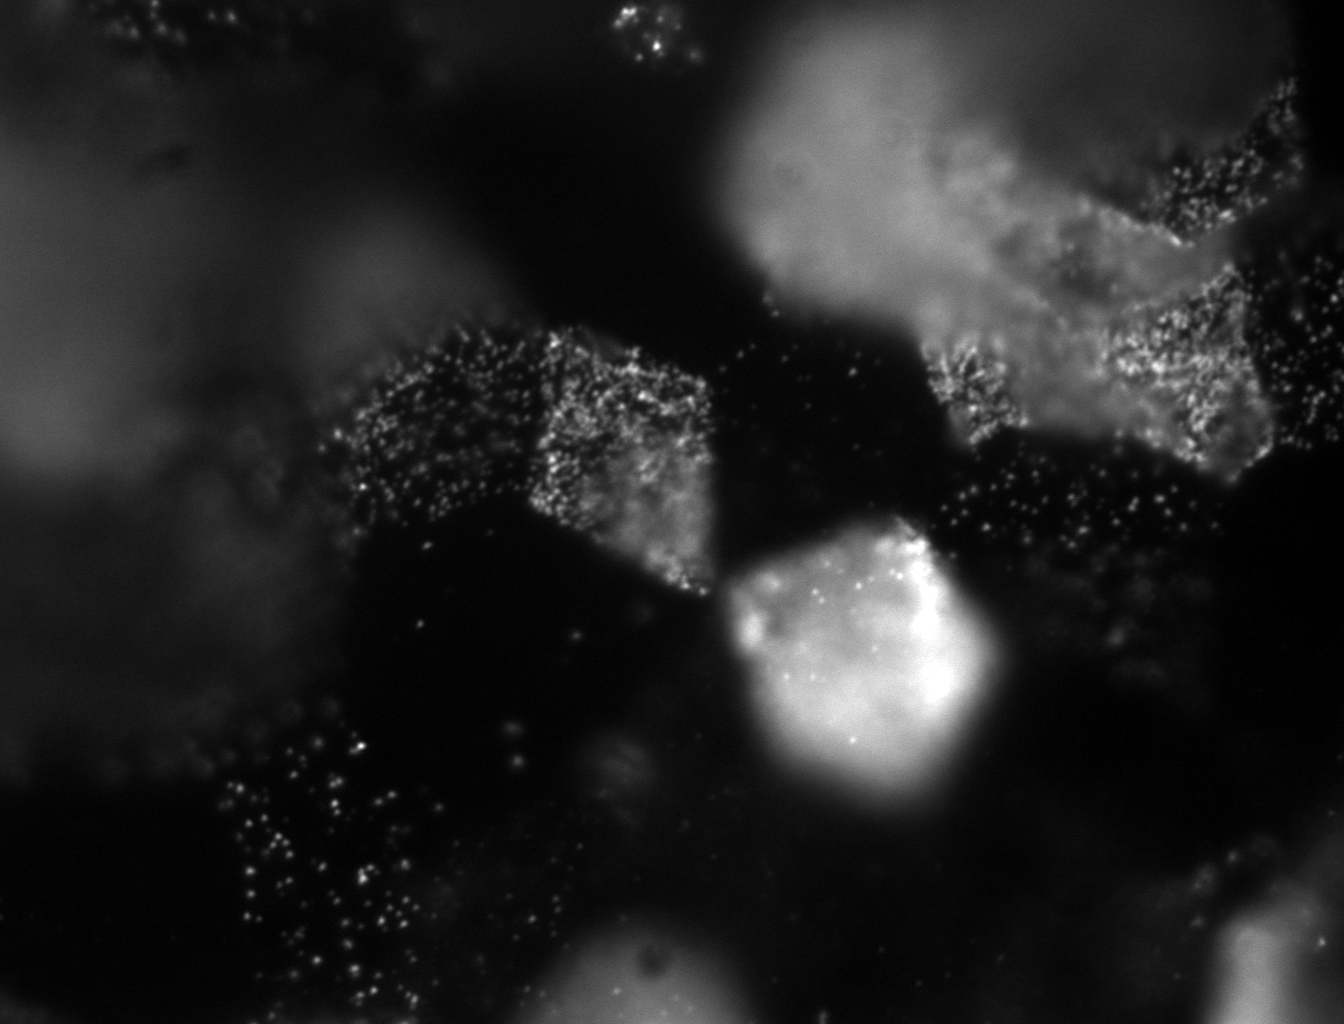
Slice through epithelial cell culture.

The image above shows one frame from a stack of images taken of a human lung epithelial cell culture.  The well-separated spots were thought to be cross sections through cilia sticking out the tops of cells.  There are some bright spots on the labeled cells and others (near the left of the image) that were thought to be above cells.

The ImageSurfer image shown below  revealed that they were in fact isolated blobs of dye that were outside of the cells.
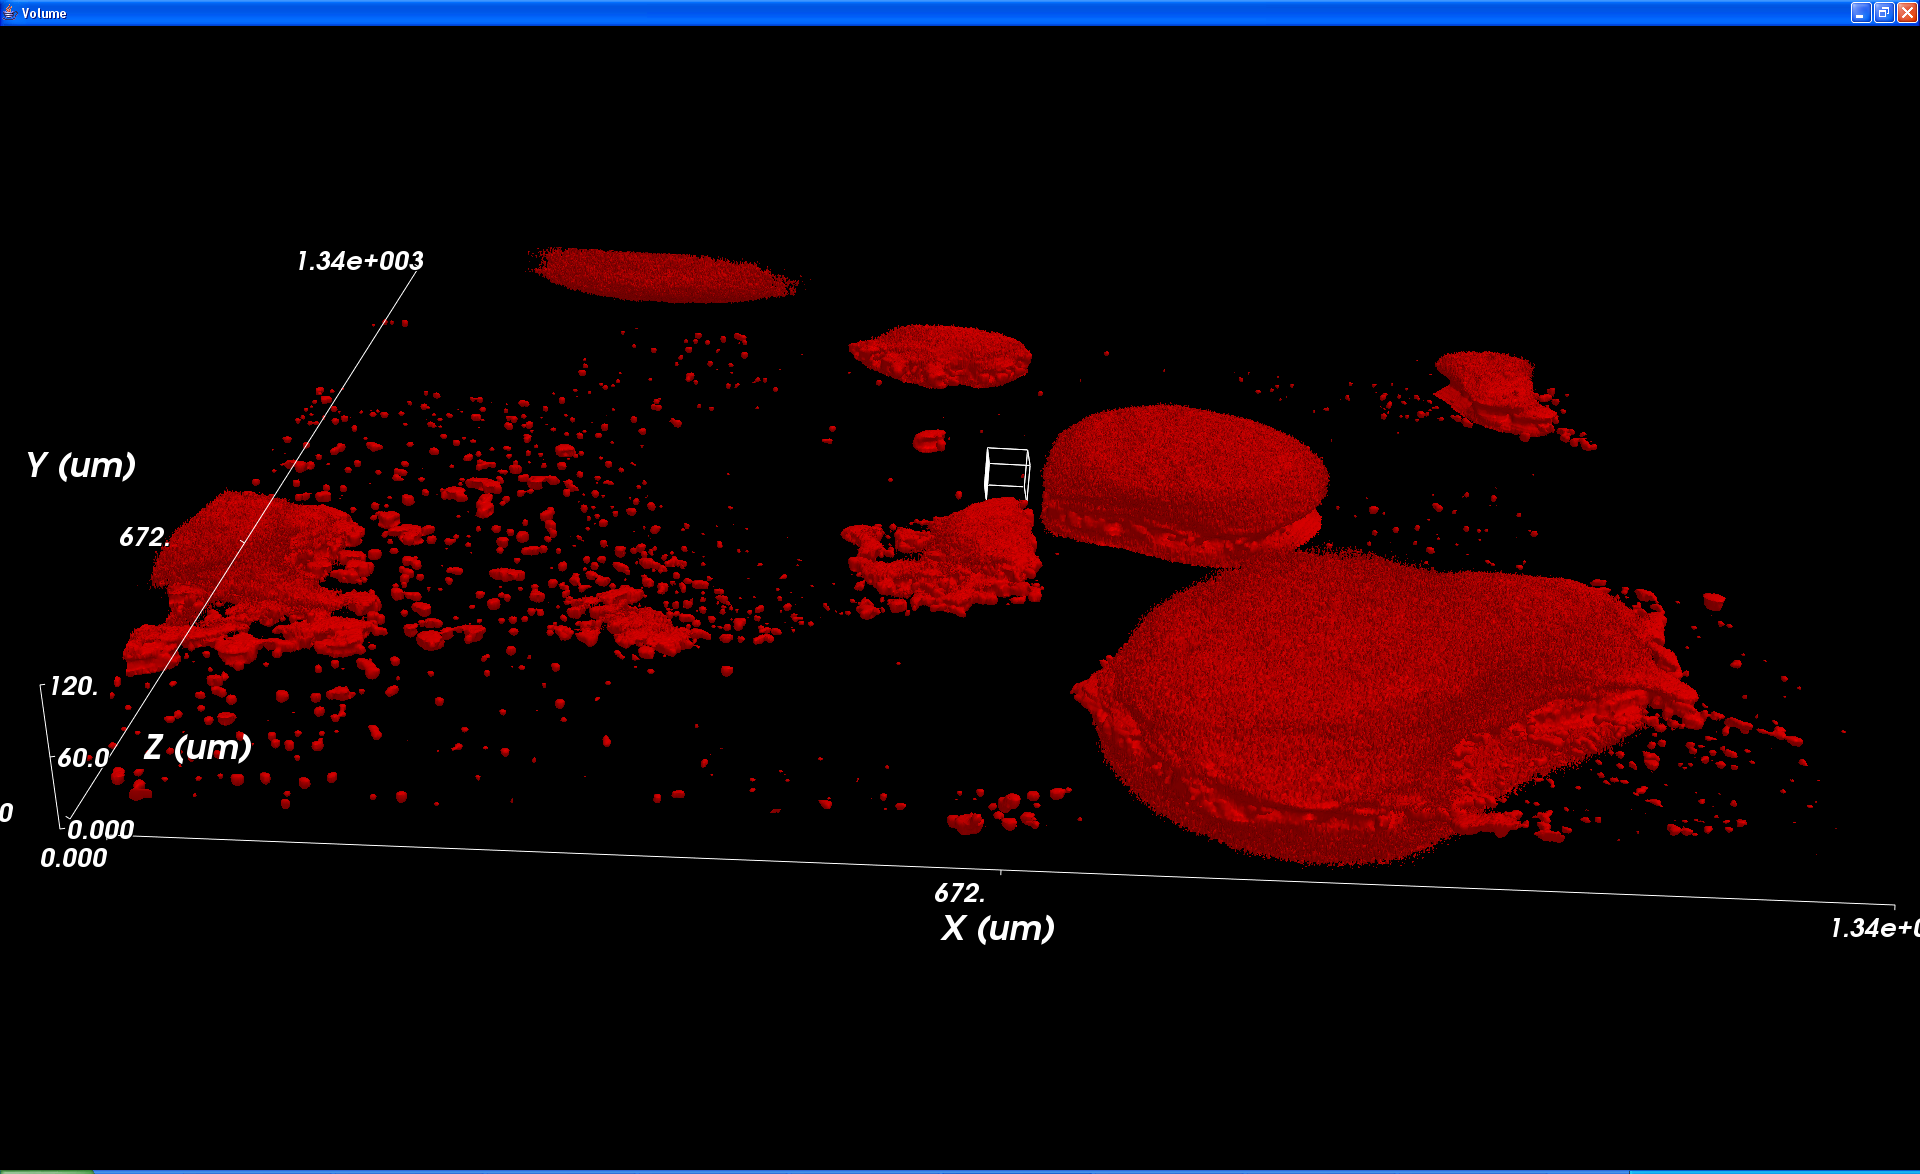
ImageSurfer 3D view of epithelial cells


Mitotic Spindle 3D model overview

April 12, 2009
3D Spindle Model Overview

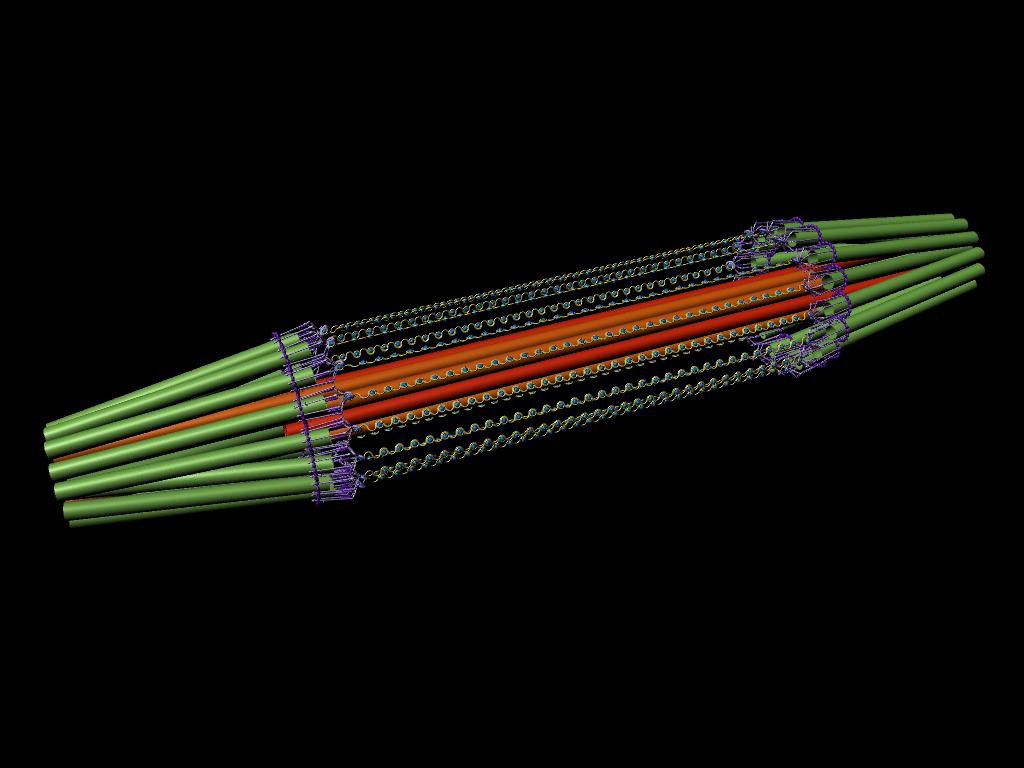
This is an image of Kendall McKenzie’s 3D model of the mitotic spindle made in Maya rendered from an overview perspective.

Fibrin Network Tracking

March 17, 2009

In this movie, we show a fibrin network stretched using an AFM tip and then tracked using CISMM’s video spot tracker.  The distribution of fiber strains within the network is then analyzed.  The goal is to understand the influence of single fiber mechanics on the properties of entire networks.

Click here for youtube video.

Click here to download original movie combined-stacks_4.avi.

Broad-Illumination Rendering of fibrin on BASS

February 13, 2009
iMiJ.pdb: Native Chicken Fibrinogen rendered using broad illumination on the BASS (NIH 1S10RR023069-01)

CISMM is one of the primary users of the Biomedical Analysis and Simulation Supercomputer (BASS) system that was commissioned yesterday.  One of the first uses of the machine was to construct a high-resolution rendering of fibrinogen (blood clotting molecule of interest to our thrombisis collaborators Susan Lord, John Weidel, Martin Guthold, and Alisa Wolberg).  This is a prototype for the PDB rendering project in collaboration with David Banks at with the Klaus Schulten NCRR on Macromolecular Modeling and Bioinformatics.

Fluorescence Microscope Simulation of the Mitotic Spindle

February 1, 2009
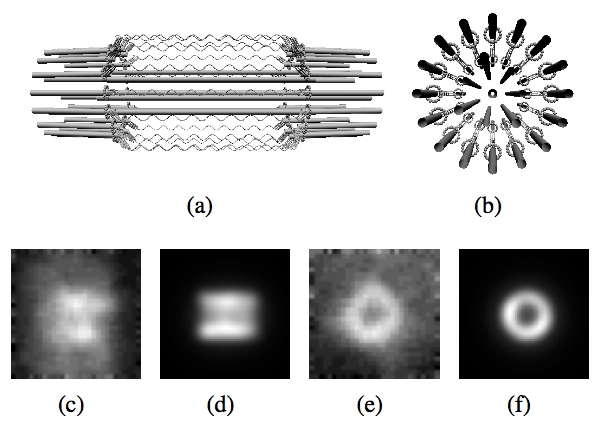
The mitotic spindle model (Yeh et al., 2008). (a) Side-on view; (b) end-on view. Helices represent the chromatin labeled with green fluorescing protein. Experimental and noise-free simulated images in side-on orientation (c-d) and end-on orientation (e-f). Differences in background between experimental and simulated images are caused by external chromatin not accounted for in the model. Structural variation in real specimens account for shape discrepancies.

Adenovirus with DNA

January 22, 2009
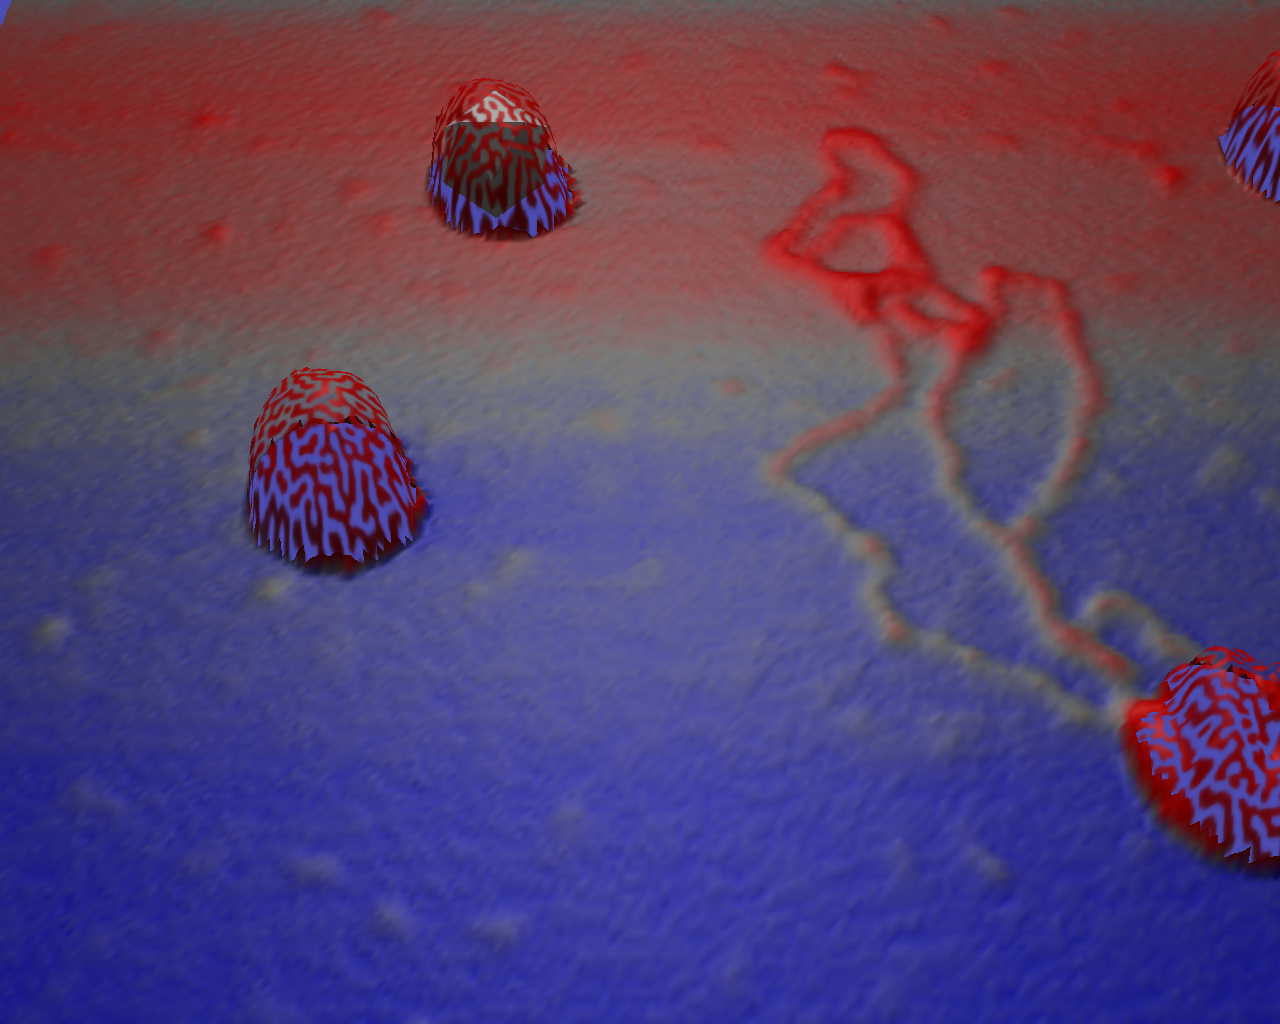
This image of adenovirus on a silicon substrate was scanned using the nanoManipulator. An adenovirus capsid has disrupted, spilling its DNA onto the surface in a tangle. The portion of the image above a certain height has been made semitransparent by adding an opacity texture. This enables us to see through the image to the icosahedral model of an adenovirus drawn with the virus in the upper left corner. Surface color is according to height. The surface has a slight slope, resulting in uniform blue, gray, and red areas.
This image of adenovirus on a silicon substrate was scanned using the nanoManipulator. An adenovirus capsid has disrupted, spilling its DNA onto the surface in a tangle. The portion of the image above a certain height has been made semitransparent by adding an opacity texture. This enables us to see through the image to the icosahedral model of an adenovirus drawn aligned with the virus in the upper left corner. Surface color is according to height. The surface has a slight slope, resulting in uniform blue, gray, and red areas.

What a Protein Looks Like

January 22, 2009

Movie: what_protein_looks_like4

caption:

This visualization, produced in 1982 and narrated by Duke Biochemist Jane Richardson, shows many ways to visualization the protein Copper-Zinc Superoxide Dismutase. Jane explains the benefits of providing many different visualization for the same system. Each visualization has its own strengths and weaknesses, making it suitable for some tasks and not others. Taken together, they provide a more complete understanding of the protein. (475 Megabytes, may take awhile to load)

Fibrin Sheets

January 22, 2009
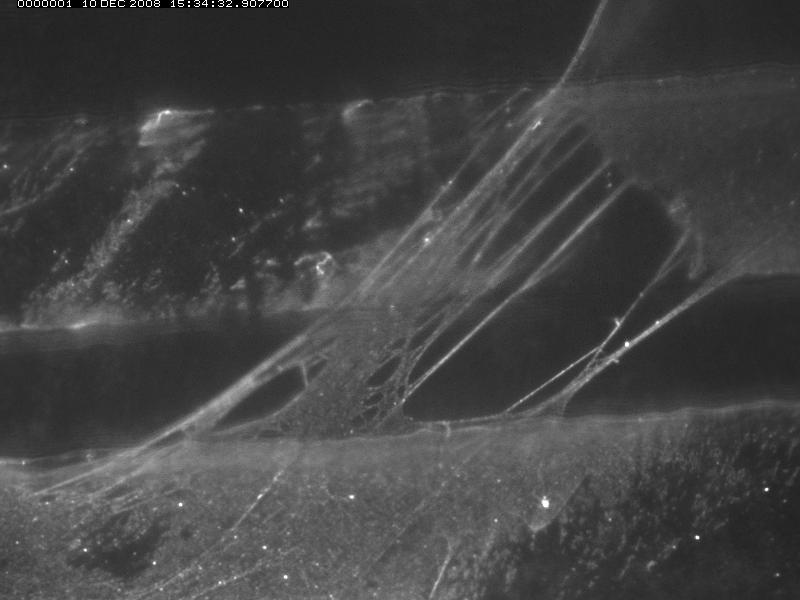
Molecularly thin fibrin sheets have been observed during experiments in our group.  There is some evidence that these sheets develop into fibrin networks.  Here is one image showing perhaps this exact phenomenon.  A sheet is laying across ridges made of hardened optical glue.  However the sheet appears to be separating into individual fibers.
Molecularly thin fibrin sheets have been observed during experiments in our group. There is some evidence that these sheets develop into fibrin networks. Here is one image showing perhaps this exact phenomenon. A sheet is laying across ridges made of hardened optical glue. However the sheet appears to be separating into individual fibers.

Fibrin Networks

January 22, 2009
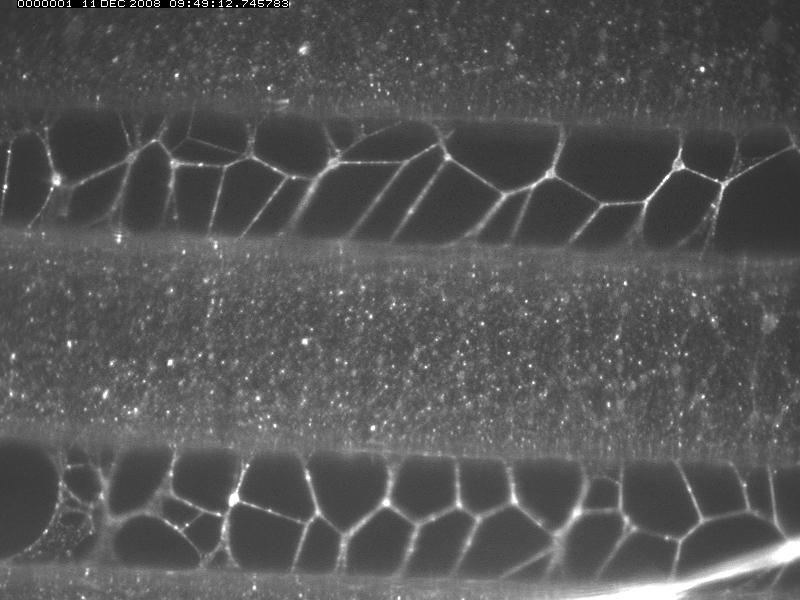
Here is an example of a series of fibrin networks formed between ridges of optical glue.  Perhaps they formed from a sheet?
Here is an example of a series of fibrin networks formed between ridges of optical glue. Perhaps they formed from a sheet?